Inflation, Manufacturing, Retail Sales, and Market Complacency

Photo Credit: Ethan Robertson, Unsplash
Weekly Market Recap for July 18th
This week, the markets traded cautiously with the S&P 500 stuck in a narrow trading range since the start of July. The Nasdaq, tech sector, and growth factor outperformed, while value, low volatility, and equal weight traded lower. Small ended the week with a slight loss, underperforming the S&P 500. Overseas, emerging markets outperformed both developed markets and the S&P 500. Rising Treasury yields weighed on long-duration bonds in fixed income, with the 30-year yield climbing sharply. Short-duration bonds were flat, as the front end of the yield curve held steady. Investment-grade corporate bonds underperformed due to their longer durations, while high-yield corporate bonds ended the week flat despite modest spread widening. Gold was changed a little, oil traded higher, Bitcoin set a record high early in the week, and the US dollar strengthened.
S&P 500 Index (Last 12 Months)

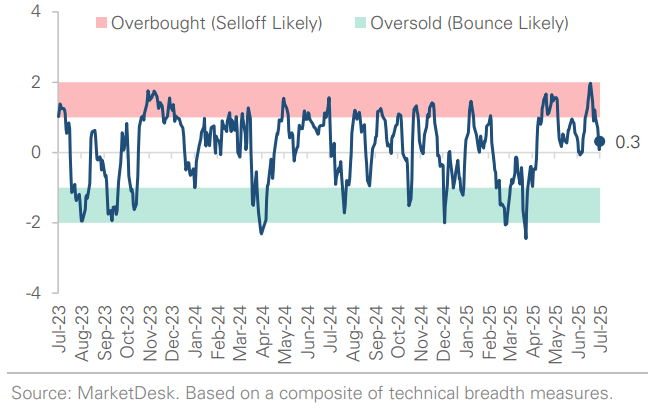
S&P 500 Technical Composite (Last 24 Months)
US Risk Demand Market Indicator
The US Risk Demand Indicator (USRDI) is a quantitative tool to measure real-time investor risk appetite. When the indicator is above zero, it signals a risk-on environment favoring cyclical sectors, high beta stocks, high-yield corporate bonds, and hybrid (convertible) bonds. In contrast, a reading below zero signals a risk-off environment favoring defensive sectors, low-volatility stocks, and US Treasury bonds.

US Market Economic Cycle Indicator
The Market Cycle Indicator tracks two primary investor groups: macro investors and price-based investors. Macro investors rely on fundamental and economic data to guide their decisions, while price-based investors (or technical analysts) focus on price action, momentum, volume, and behavioral trends. The Indicator synthesizes these perspectives to identify the prevailing market regime.

S&P 500 Valuation Matrix

Key Takeaways
#1 - Headline CPI Rose +0.3% in June
The Headline Consumer Price Index (CPI) index rose 0.3% to a year-over-year rate of 2.7% at the fastest pace since January. Prices for tariff-affected goods like sporting goods (+1.4%), household furnishings (+1.0%), and apparel (+0.4%) rose as the first wave of tariffs filtered through to prices. Core CPI posted a more modest +0.2% increase. Shelter inflation contributed about one-third of the monthly gain but continues to slow year-over-year, helping offset price pressures in the goods category. Producer prices were flat in June, below the +0.2% consensus estimate. Within PPI, goods rose +0.3%, while services fell -0.1%.
Implication: Inflation progress is slowing but not reaccelerating. The data suggests that goods prices are rising because of tariffs, which will likely prevent the Fed from cutting rates in July.
Headline CPI Shows Early Tariff Price Pressures

Producer Prices Flat as Goods Rise and Services Fall

#2 - Industrial Production Rose +0.3% in June
Utilities output jumped +2.8% due to a heat wave and accounted for most of June's strength, while mining fell by -0.3% as oil and gas drilling declined for a third month. Industrial output expanded at a +1.1% annualized pace in Q2, a slowdown from Q1's +4.3%. Manufacturing rose by only +0.1%, held back by a -2.6% drop in auto production.
Implication: June's industrial rebound was real but narrow, driven by weather and sector-specific gains rather than a broad increase. The moderate uptrend that started late last year is intact, but momentum is fading.
Industrial Rebound Loses Momentum in Q2

#3 - Retail Sales Rose +0.6% in June
Retail sales rose +0.6% in June, rebounding from May’s -0.9% decline. Gains were broad-based, led by autos (+1.2%), clothing (+0.9%), and building materials (+0.9%). Food services (+0.6%) and e-commerce (+0.4%) also contributed, while home furnishings, electronics, and furniture all fell by -0.1%. Control group retail sales, which feed directly into GDP, rose +0.5%, but growth gradually slowed.
Implication: June’s report was better than expected and eases concerns that consumer spending is rolling over after two negative prints in April and May.
Consumer Spending Growth Positive But Slowing

#4 - A Cooling Economy
June’s data point to a gradually cooling economy, but not weak enough to justify a July rate cut. Growth momentum has slowed in the labor market, consumer spending, and industrial production. However, it is a gradual deceleration, and growth is still positive. At the same time, early signs of tariff-related price pressures are emerging.
Implication: The Fed will likely hold rates steady in July, with cuts later this year dependent on further inflation progress. Politics and concerns about Fed independence likely raise the bar for cuts, meaning it could take clear signs of weakness for the central bank to act.
Initial Job Claims Fall While Continued Claims Hold Steady

Rate Cut Expectations Lowered Month-To-Date

#5 - Trade Policy Uncertainty
Trade policy uncertainty remains elevated, but the market seems unconcerned. Implied volatility, which measures investor expectations for near-term market movements, has recently declined across stocks, bonds, gold, and currencies. The decline indicates investors expect calm, stable conditions in the near term, despite continued uncertainty in trade policy.
Implication: The market is brushing off policy risks for now, but this calm could be tested if trade tensions re-escalate.
Important Disclosures
This material is provided for general and educational purposes only and is not investment advice. Your investments should correspond to your financial needs, goals, and risk tolerance. Please consult an investment professional before making any investment or financial decisions or purchasing any financial, securities, or investment-related service or product, including any investment product or service described in these materials.
Our Insights