2021 Q3 Recap and 2021 Q4 Outlook
Delta Variant Signals the Pandemic’s Continued Grip
The highly transmissible delta variant grabbed headlines during the third quarter. Figure 1 shows the number of daily new confirmed Covid-19 cases spiked starting in July as the delta variant spread. Covid case counts remained elevated during August before the growth rate of new cases slowed and trended back lower during September. The U.S.’s fourth Covid wave occurred as the pace of vaccinations slowed and the percentage of fully vaccinated individuals fell below foreign countries. The official response to the fourth Covid wave differed considerably from prior Covid waves. Instead of returning to the strict lockdowns used early in the pandemic, public officials emphasized vaccinations and masking. While the change in approach blunted the delta variant’s economic impact, the economic recovery still encountered separate labor market and supply chain headwinds during the third quarter. Those headwinds caused both Wall Street economists and the Federal Reserve to lower their GDP growth estimates for the remainder of 2021.
Supply Chain Disruptions Pressure Growth Outlook
Supply chain disruptions continue to act as a constraint on manufacturing activity. The disruptions are caused by a combination of parts and labor shortages, as well as gridlock at ports, warehouses, and railroads. Companies report it is difficult to source the materials they need to produce goods, which in turn is leading to depleted inventories and further intensifying supply chain issues. The most notable disruption is occurring in the auto industry, where a semiconductor shortage is holding back auto manufacturers.
The friction created by supply chain disruptions is turning up in economic data. As an example, August manufacturing surveys conducted by regional Federal Reserve bank branches were weaker than economists’ forecasts. The weak data highlights the difficulties manufacturers face as they work to restart production. While recent data is weaker compared to earlier this year, it is important to point out manufacturing growth remains positive. Case in point, the Federal Reserve reported industrial production expanded month-over-month during August despite Hurricane Ida closing refineries and petrochemical plants along the Gulf Coast and auto production declining slightly. The economy’s resiliency is impressive as it faces the delta variant and other economic disruptions.
Inflation Pressures Remain Elevated but Ease Slightly
Inflation pressures remained elevated during the third quarter as the economy battled the labor shortage and supply chain disruptions. The Personal Consumption Expenditures (PCE) Price Index, which measures the prices individuals pay for goods and services, rose +4.3% year-over-year during August 2021. While August’s PCE inflation year-over-year reading was the highest since January 1991, more recent month-over-month data indicates the growth rate of inflation is easing as the economy gradually reopens and inflationary pressures fade. The PCE price index rose +0.4% month-over-month during August compared to +0.5-0.6% during each of March, April, May, and June 2021.
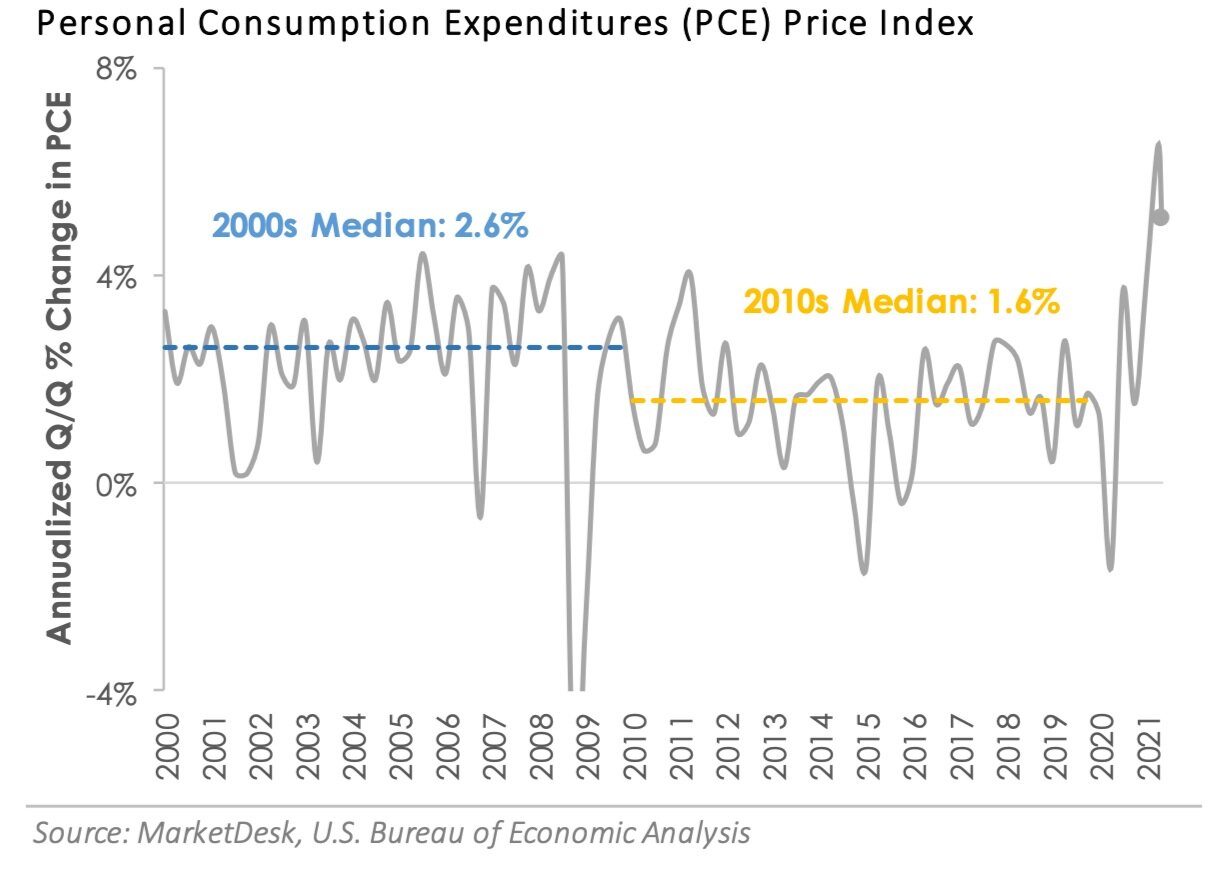
The chart shows the PCE inflation rate held above 2% for most of the 2000s but fell below 2% for most of the 2010s. With inflation spiking this year, the question moving forward is, “Where does the inflation rate settle during the 2020s”? The Federal Reserve believes inflation pressures are transitory (i.e., temporary), implying inflation will settle back to levels from the 2010s. However, some investors believe inflation pressures will persist for an extended period of time, which implies the inflation rate will return to the levels experienced in the 2000s. It is still too early to tell, but the answer will have profound investment implications in the years ahead.
Credit Markets Track Evolving Investor Sentiment
Fears of an economic growth slowdown also impacted credit markets during the third quarter. While interest rates across the Treasury yield curve ended the third quarter mostly in line with where they started, their path during the quarter shows how the delta variant and headwinds mentioned above impacted yields. As growth fears took hold at the start of the quarter, investors purchased bonds and pushed the yield on the 10-year U.S. Treasury from 1.45% at the start of July to 1.22% on July 30th. The 10-year Treasury yield bottomed in early August, drifted sideways through mid-September, and then surged higher in late September as inflation expectations picked back up and Covid trends improved.
Interest rate moves during the quarter impacted credit market performance. Investment grade corporate bonds, which tend to be longer maturity and therefore more sensitive to interest rate moves, outperformed high yield corporate bonds during July as interest rates declined due to economic growth fears. As interest rates stabilized and reversed higher in late September, high yield bonds outperformed due to their shorter duration (i.e., lower sensitivity to interest rate moves). The third quarter ended with high yield bonds generating a +0.3% total return, slightly outperforming investment grade’s -0.4% total return.
The Federal Reserve continues to play a key role in the credit market as it works through when to start tightening monetary policy. Markets expect the Fed to start reducing its monthly bond purchases sometime during the fourth quarter. At the same time, markets expect the Fed to keep interest rates low through most of 2022. Uncertainty regarding the Federal Reserve’s upcoming policy decision could keep financial markets volatile in the months ahead. Markets tend to grow anxious when the Federal Reserve makes major monetary policy moves.
Fourth Quarter 2021 Outlook – Can it Continue?
The third quarter ended in a similar fashion to the second quarter. Market volatility increased as investors struggle to keep pace with fluctuating Covid trends and economic headwinds. The catch is investor concerns flipped from the start to the end of the third quarter. While the second quarter ended with investors worrying about the economic outlook and delta variant, the third quarter ended with investors regaining confidence in the reopening and Covid trends improving. The equity and credit market commentary highlights how investors’ shifting outlook impacted performance trends.
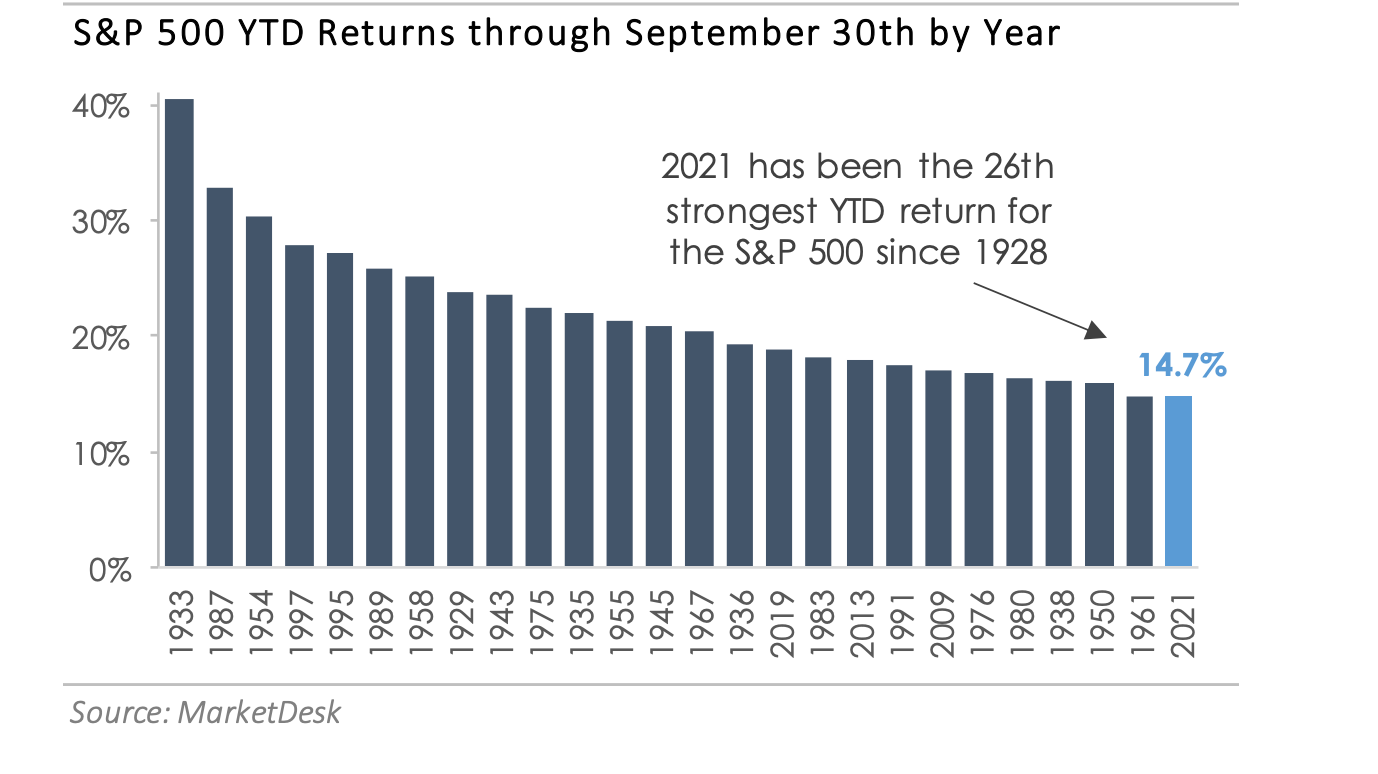
Going back to 1928, 2021 ranks as the 26th strongest S&P 500 YTD (through September 30) return. Along the way this year, the S&P 500 has compiled a growing list of new all-time closing highs. The performance data shows equity markets have covered a lot of ground since their pandemic trough.
What happens next? From a performance perspective, strong returns in one year do not necessarily indicate markets will sell off the next year. However, strong returns do suggest the market already prices in a robust recovery. In the months ahead, the equity market may become more reliant on earnings growth rather than increasing valuation multiples to power further gains. The encouraging news is corporate profit margins held up surprisingly well during the pandemic. The question is whether earnings can continue to grow. Markets will be paying close attention during the third quarter earnings season to understand how the labor shortage, supply chain disruptions, and inflationary pressures are impacting businesses.
Our Insights