

Photo Credit: Getty Images
Weekly Market Recap for October 23rd
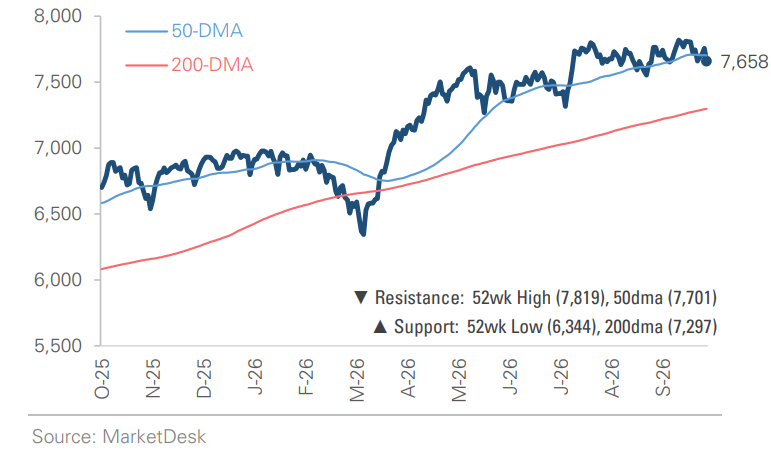
Markets traded lower this week, although performance beneath the major indexes was stronger. The S&P 500 fell -1.1%, and the Nasdaq declined -3.4%, while the Russell 2000 small-cap index gained +0.3%. The Equal-Weight S&P 500 rose +1.2%, highlighting broad participation despite tech weakness, and Value (+0.9%) outperformed Growth (-3.6%). Eight of eleven sectors traded higher, led by Consumer Staples (+3.5%), Utilities (+2.7%), and Financials (+2.4%). Technology (-3.9%) and Communication Services (-4.8%) lagged. Bonds rallied as Treasury yields fell, with long-maturity Treasuries up +2.3% versus +0.3% for short-maturity bonds. Investment-grade corporate bonds rose +0.8%, while high-yield bonds were flat. Oil rose +2.8%, the U.S. dollar modestly weakened, and the VIX ended flat after a late-week spike.
S&P 500 Index (Last 12 Months)
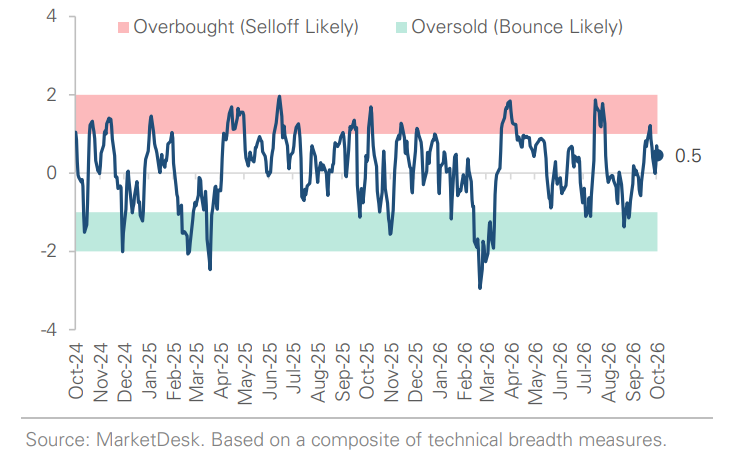
S&P 500 Technical Composite (Last 24 Months)
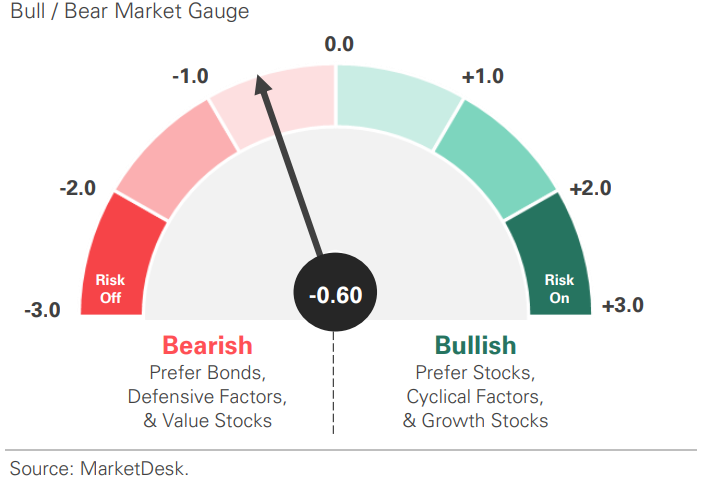
US Risk Demand Market Indicator
The US Risk Demand Indicator (USRDI) is a quantitative tool to measure real-time investor risk appetite. When the indicator is above zero, it signals a risk-on environment favoring cyclical sectors, high-beta stocks, high-yield corporate bonds, and hybrid (convertible) bonds. In contrast, a reading below zero signals a risk-off environment favoring defensive sectors, low-volatility stocks, and US Treasury bonds.
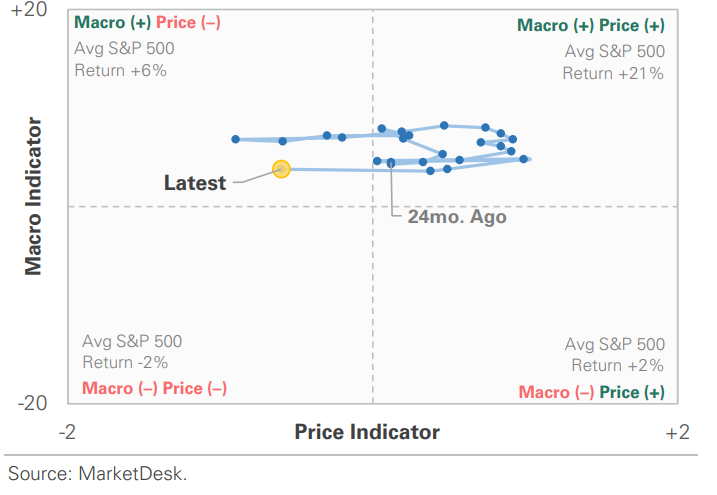
US Market Economic Cycle Indicator
The Market Cycle Indicator tracks two primary investor groups: macro investors and price-based investors. Macro investors rely on fundamental and economic data to guide their decisions, while price-based investors (or technical analysts) focus on price action, momentum, volume, and behavioral trends. The Indicator synthesizes these perspectives to identify the prevailing market regime.
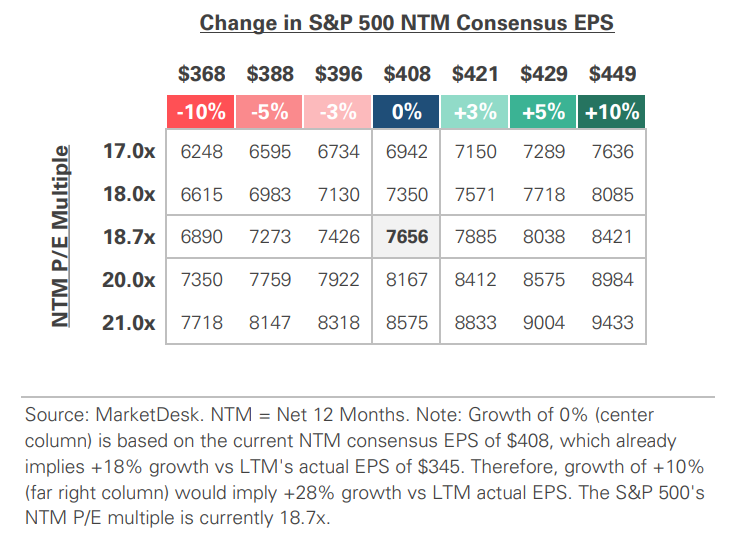
S&P 500 Valuation Matrix
S&P 500 Forward PE Ratio
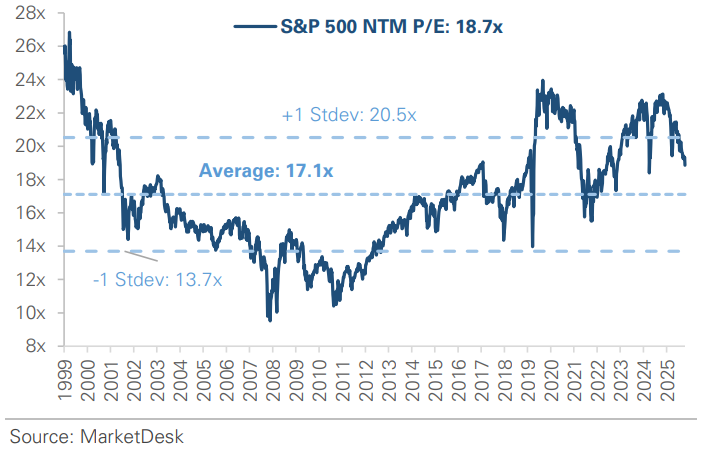
The S&P 500 forward price-to-earnings (P/E) ratio is a widely followed valuation metric that compares the index's current level to the projected earnings of its constituent companies over the next 12 months. The indicator implies to investors how much they are paying today for each dollar of expected future earnings.
Key Takeaways
#1 - Housing Market Weakens Further
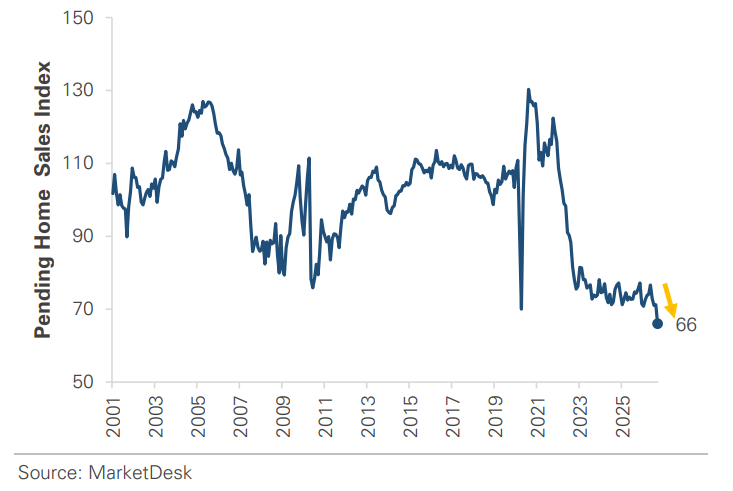
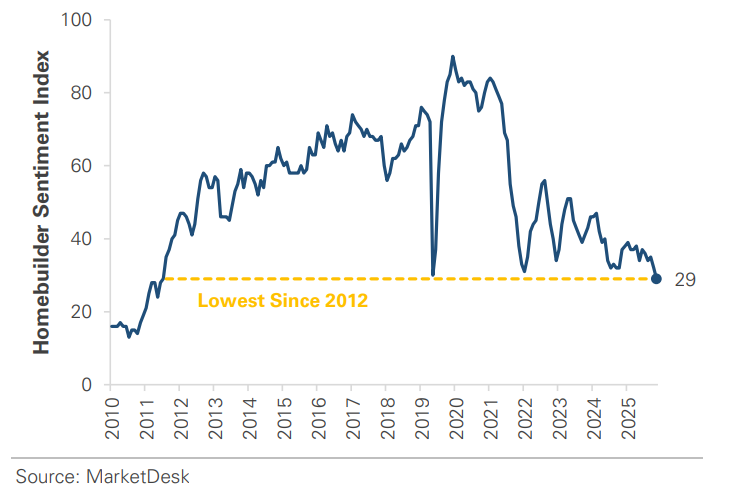
Pending home sales, which measure contracts to purchase existing homes, fell -7.3% in September, with the index at its lowest level since tracking began in 2001. Housing starts declined -5.2% in September to an annualized rate of 1.22 million units, the second weakest reading since the pandemic. Homebuilder confidence fell to 29 in October, its lowest level since 2012 and well below the neutral level of 50. The weakness is tied to the average 30-year fixed-rate mortgage being above 7%, which is among the highest levels since the early 2000s. High borrowing costs and persistent affordability challenges have discouraged buyers, while elevated construction costs have weighed on builders, leading them to reduce prices and offer incentives to attract buyers.
Implication – The breadth and severity of the latest declines underscore how much housing has weakened relative to other areas of the U.S. economy.
Pending Home Sales Index
Homebuilder Sentiment Index
#2 - Technology Drives Industrial Growth
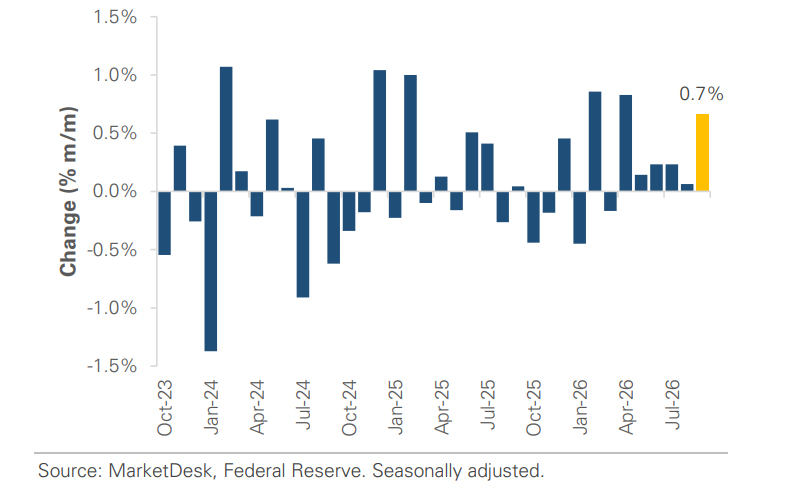
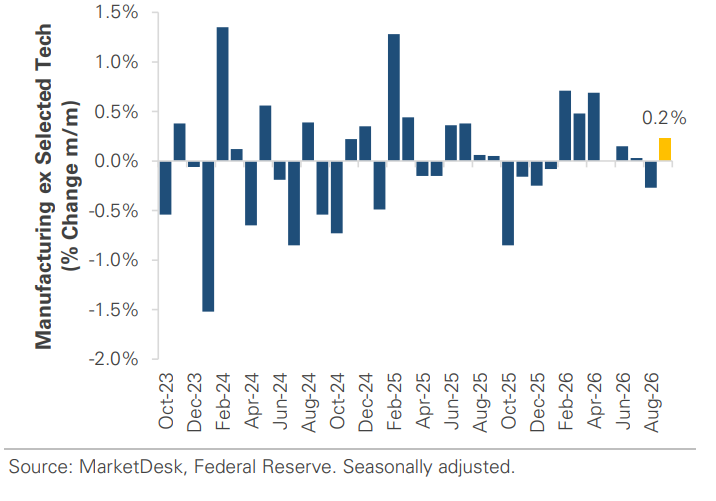
Headline industrial production rose +0.7% for the month, helped by a +3.5% increase in utility output tied to unseasonably high temperatures and increased demand for electricity and natural gas. Meanwhile, manufacturing output increased by a more modest +0.3%. Looking at the full third quarter, semiconductor and electronic-component production grew at a +28.4% annualized rate, helping support manufacturing activity. However, manufacturing output excluding selected high-technology industries was nearly flat, increasing at just a +0.1% annualized rate
Implication – Technology-related manufacturing continues to support industrial growth, while activity across the broader manufacturing sector remains more modest.
Industrial Production Continues to Expand
Manufacturing is Modest After Removing Tech
#3 - Trade Prices Rise Sharply
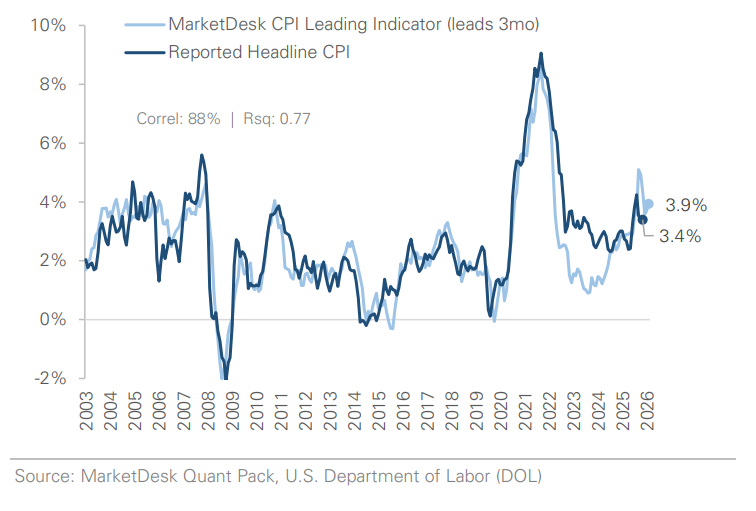
Prices for goods imported into the U.S. increased +1.1% for the month and +8.1% over the past year. Higher fuel prices contributed to the increase, but import prices excluding fuel also rose +0.7%. In addition, prices received by U.S. exporters increased +2.2% for the month and +11.6% over the past year. These figures reflect prices paid and received in international trade, not prices charged directly to consumers.
Implication – The report adds a business-level perspective to last week's consumer and producer inflation data, providing further evidence of the breadth of September's price increases.
U.S. CPI Leading Indicator
#4 - Stocks Hover Near Records
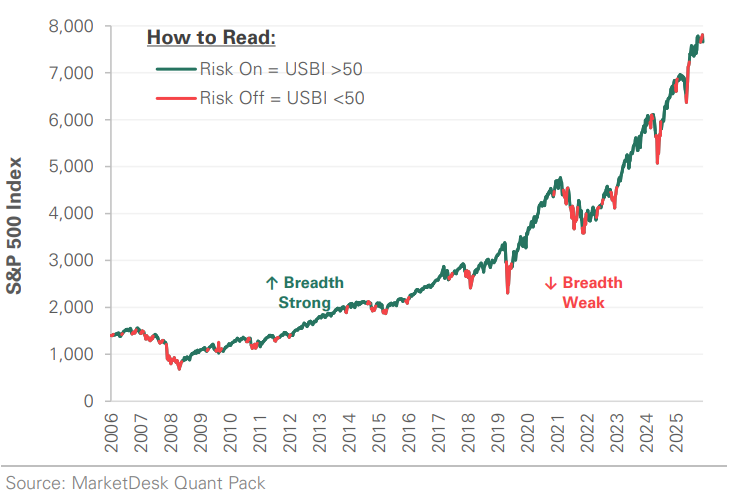
Large technology companies, particularly those tied to artificial intelligence and semiconductors, have experienced sharp swings in recent weeks. However, other sectors, including some that had previously lagged the broader market, have partly offset the weakness in technology and AI companies.
Implication – Recent market volatility has largely reflected changes in leadership rather than a broad-based retreat from stocks.
S&P 500 Index and Historical USBI Readings
Important Disclosures
This material is provided for general and educational purposes only and is not investment advice. Your investments should correspond to your financial needs, goals, and risk tolerance. Please consult an investment professional before making any investment or financial decisions or purchasing any financial, securities, or investment-related service or product, including any investment product or service described in these materials.
Our Insights