Earnings Season, Large Intraday Moves, Fed Policy, and Global Rotation

Photo Credit: Anita Austvika, Unsplash
Weekly Market Recap for April 18th
This week, the S&P 500 ended the week flat after giving back most of its early week gains tied to the administration exempting tech products from China tariffs. The Nasdaq returned -0.5%, with the Magnificent 7 and Technology leading to the downside after last week’s relief rally. High beta and growth factors underperformed, while low volatility, value, and equal weight factors outperformed. Most sectors beat the S&P 500 as the mega-cap-heavy Consumer Discretionary, Technology, and Communication Services dragged down the index. Treasury yields reversed last week’s spike in the bond market, boosting Long Duration Treasuries. Corporate bonds also gained as credit spreads tightened. Meanwhile, the CBOE VIX and MOVE indices declined as stock and bond market volatility eased. International posted another strong week, and USD weakened, suggesting investors continue to rotate out of US assets.
S&P 500 Index (Last 12 Months)

S&P 500 Technical Composite (Last 24 Months)

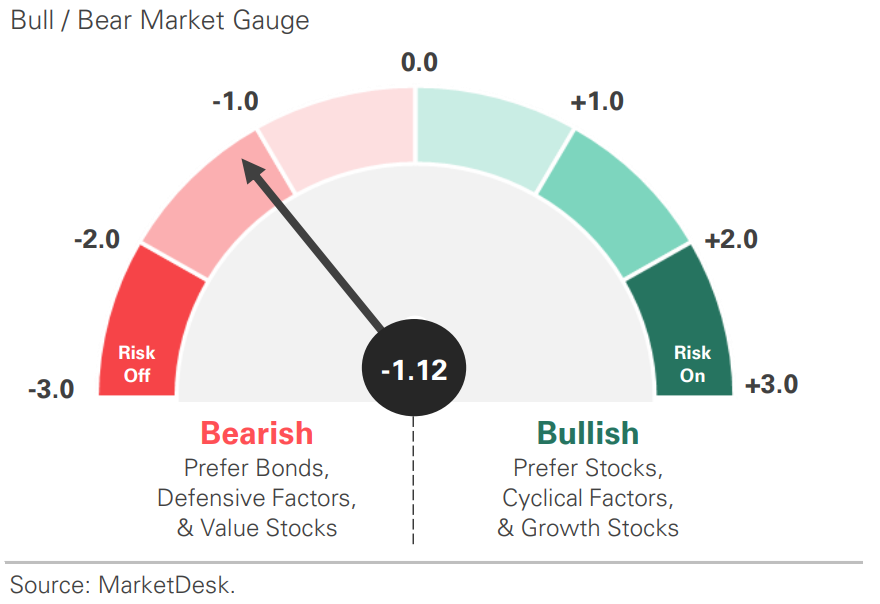
Bull Bear Market Indicator
US Market Economic Cycle

S&P 500 Valuation Matrix

Key Takeaways
#1 - S&P 500 Recorded One of its Largest Single-Day Gains
Last week, the S&P 500 recorded one of its most significant single-day gains after the administration paused reciprocal tariffs. The chart graphs the S&P 500’s biggest 1-day gains since 2000, showing the April 9th rally ranks third. For comparison, the chart below graphs the largest 1-day losses. Many of the dates overlap, including late 2008 and March 2020.
Implication: The market’s biggest up days tend to occur near its biggest down days, and trading them is difficult.
S&P 500 Ten Largest 1-Day Gains Since 2000

S&P 500 Ten Largest 1-Day Losses Since 2000

#2 - Policy Volatility
Late last week, news surfaced that the administration had exempted a broad range of tech products from the 145% China tariffs. On Monday, the Commerce Department announced trade probes on semiconductor and pharmaceutical imports, setting the stage for additional tariffs.
Implication: Uncertainty remains high despite the 90-day pause.
US Retail Sales Rise as Tariffs Unleash Buying Spree

US Manufacturing Expands as Businesses Front Run Tariffs

#3 - Q1 Earnings Season Highlights Rising Uncertainty
United Airlines reaffirmed its 2025 financial forecast and issued a recession scenario, citing an unpredictable macroeconomic backdrop. This follows Delta Air Lines’ decision to pull its forecast last week.
Implication: Early earnings reports reflect broad concerns about the impact of trade wars and tariffs, potential inflationary pressures, and an economic slowdown.
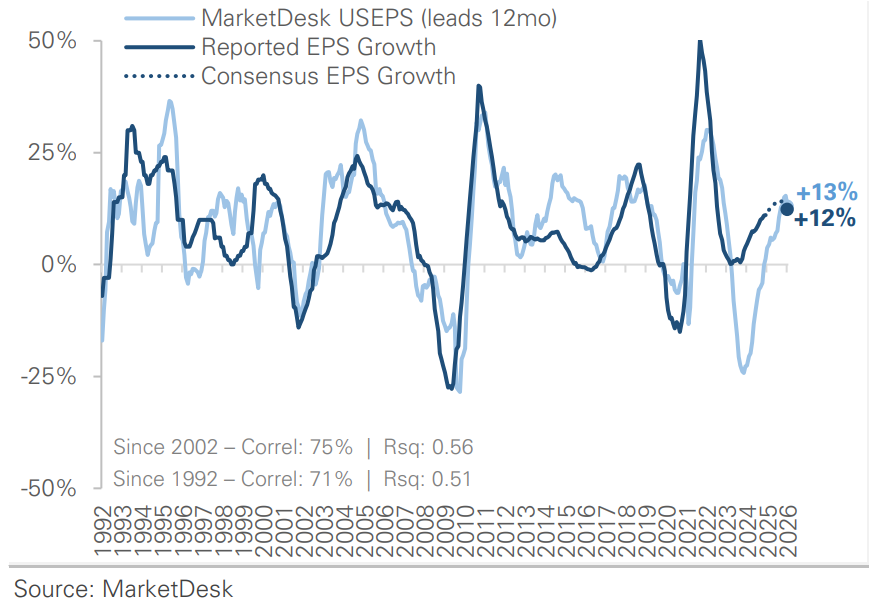
#4 - S&P 500 Earnings Indicator Has Peaked
It still forecasts growth, but like the consensus estimate, it has started to decline. The shift is being driven by weaker survey and confidence data, as businesses and consumers react to rising policy and trade uncertainty.
Implication: Recently announced tariffs have already weighed on confidence and soft survey data. The risk is that hard data slows next, leading to slower EPS growth and negative revisions.
S&P 500 Earnings Indicator
#5 - Next Fed Meeting is May 7th
Markets are pricing in a nearly 90% probability that the Fed will hold rates steady. The following meeting is June 18th, and the market places a 70% probability of the Fed cutting rates.
Implication: Investors initially expected the Fed to react to policy uncertainty by cutting rates but now expect it to take a slower approach. Our view: given the inflation uncertainty, the Fed is unlikely to cut without clear signs of a slowdown.
Market Forecast for Next Two Fed Meetings

#6 - American Exceptionalism
One theme gaining traction globally is the end of American exceptionalism. Supporters highlight two key developments: the US dollar has weakened to a three-year low, and long-term Treasury yields have surged. They attribute both to rising policy uncertainty, which is prompting capital outflows.
Implication: The US was the standout performer recently, but Q1 developments mark a potential turning point. Continued capital outflows could weigh on US assets, limiting the upside and favoring a higher allocation to international assets.
Important Disclosures
This material is provided for general and educational purposes only and is not investment advice. Your investments should correspond to your financial needs, goals, and risk tolerance. Please consult an investment professional before making any investment or financial decisions or purchasing any financial, securities, or investment-related service or product, including any investment product or service described in these materials.
Our Insights