Headline Volatility, Soft and Hard Economic Data Diverge, and Ingredients for a Market Bottom

Weekly Market Recap for April 25th
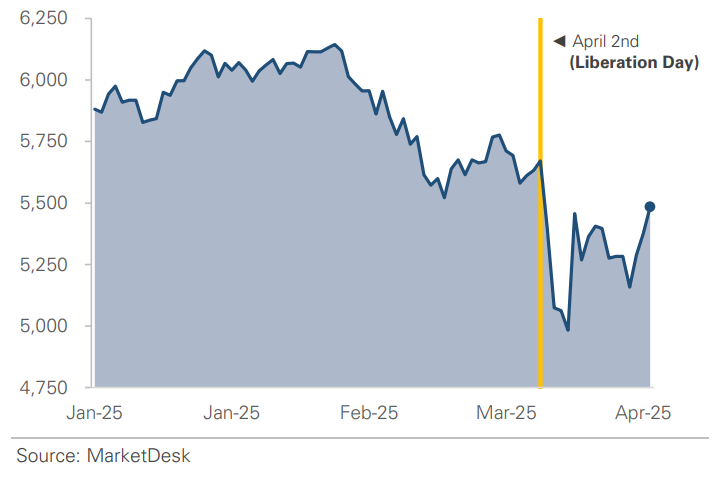
This week, stocks ended the week higher after an early-week selloff. The S&P 500 gained +3.9% as it climbed back toward “Liberation Day” levels. The index’s rally was top-heavy, with the Nasdaq gaining +5.3% while the S&P 500 Equal Weight returned +3.2%. Growth outperformed Value, and Technology was the top-performing sector. The tone was broadly risk-on: the Russell 2000 outperformed the S&P 500 with a +4.2% gain, High Beta outperformed Low Volatility, and cyclical sectors led defensives. In the fixed-income market, bonds were flat as Treasury yields stabilized. Notably, corporate high-yield outperformed as credit spreads re-tightened, another sign of improving risk sentiment
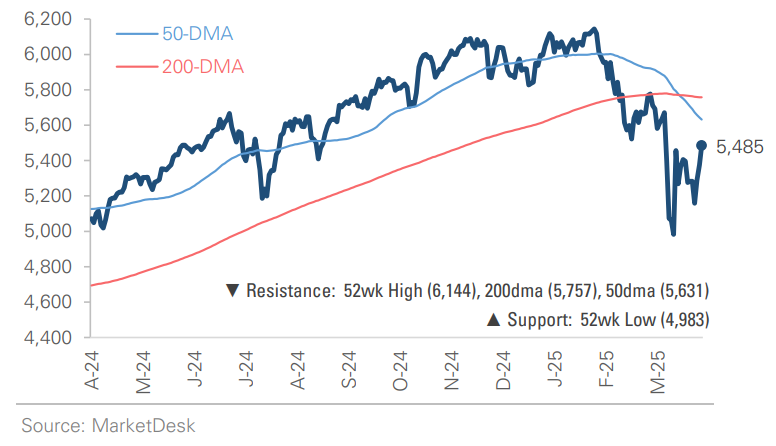
S&P 500 Index (Last 12 Months)
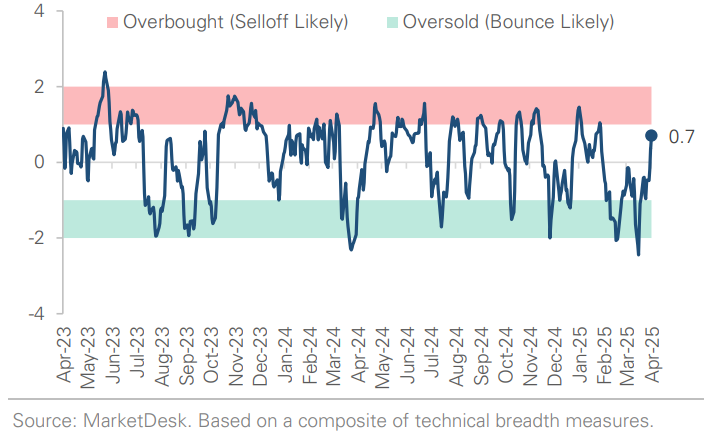
S&P 500 Technical Composite (Last 24 Months)
Bull Bear Market Indicator
The Bull Bear Market Indicator is a quantitative tool to measure real-time investor risk appetite. When the indicator is above zero, it signals a risk-on environment favoring cyclical sectors, high beta stocks, high-yield corporate bonds, and hybrid (convertible) bonds. In contrast, a reading below zero signals a risk-off environment favoring defensive sectors, low-volatility stocks, and U.S. Treasury bonds.

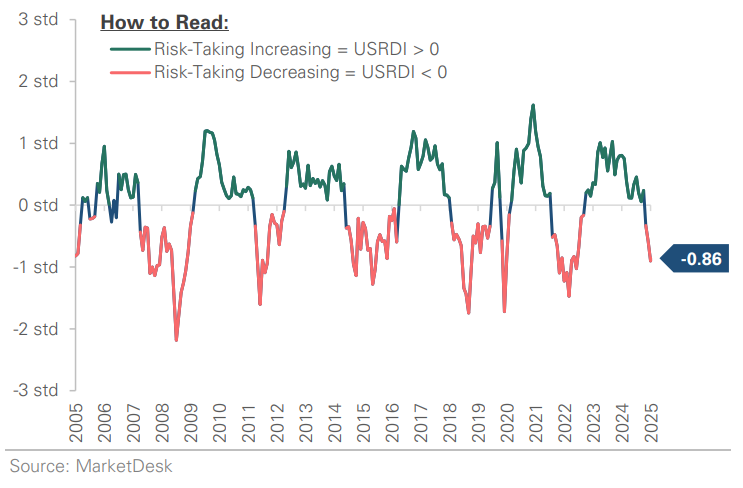
US Risk Demand Indicator
The US Risk Demand Indicator is a quantitative model that measures investors’ willingness (or lack thereof) to increase portfolio risk. The indicator is a composite of momentum measures across four asset classes: equities, equity derivatives, credit markets, and foreign currencies. A reading above zero suggests investors should increase portfolio risk to benefit from rising market momentum. A reading below zero suggests investors should decrease portfolio risk to protect capital from falling market momentum.
US Market Economic Cycle
The Market Cycle Indicator tracks two primary investor groups: macro investors and price-based investors. Macro investors rely on fundamental and economic data to guide their decisions, while price-based investors (or technical analysts) focus on price action, momentum, volume, and behavioral trends. The Indicator synthesizes these perspectives to identify the prevailing market regime.

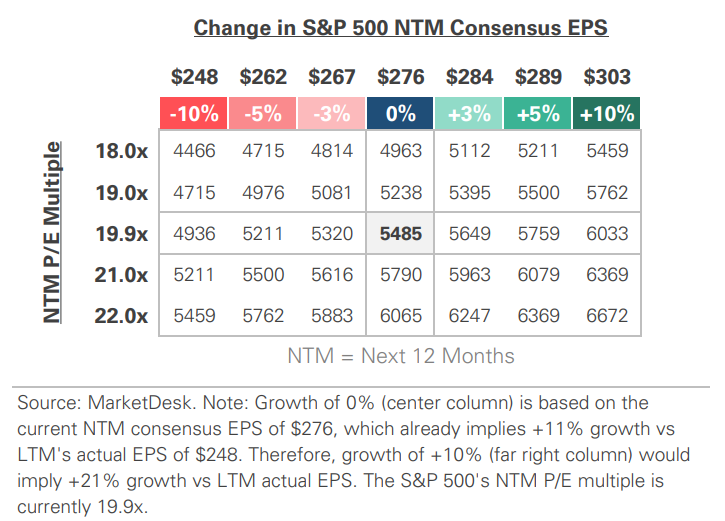
S&P 500 Valuation Matrix
Key Takeaways
#1 - Headline News Volatility Remains High
Last week, reports emerged that Trump was considering firing Fed Chair Powell. This week, Treasury Secretary Bessent told investors in a closed-door meeting that the U.S.-China standoff is unsustainable. A day later, Trump walked back his stance, saying he wouldn’t fire Powell and was considering reducing China tariffs from 145% to 50–65%. Bessent later cautioned that a full US-China trade deal could take 2-3 years.
Implication: The past few months have been marked by news volatility, and no clear end is in sight.
S&P 500 Climbs Back Toward Liberation Day Levels
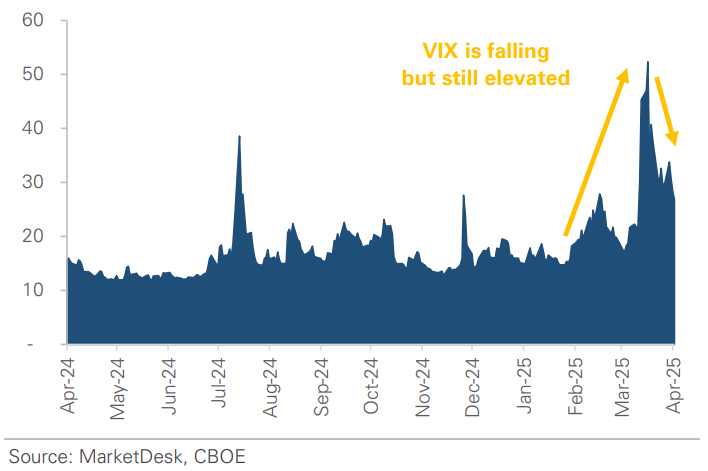
Volatility Has Declined But Remains Elevated
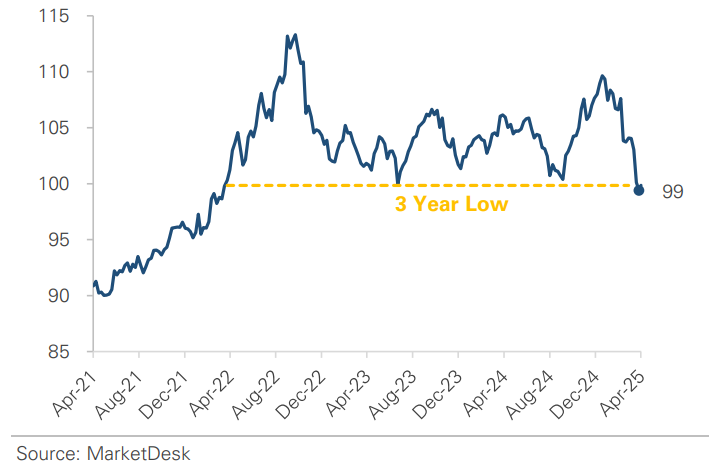
#2 - Volatility And Uncertainty Are Weighing On The US Dollar
The US dollar weakened to a three-year low this week. This weakness comes despite its traditional safe-haven status, but it occurred as Trump criticized the Fed, and tariff uncertainty remained high.
Implication: USD’s weakness supports the thesis that capital could rotate out of the US due to policy uncertainty and “the end of American exceptionalism.”
US Dollar Weakens To A 3-Year Low
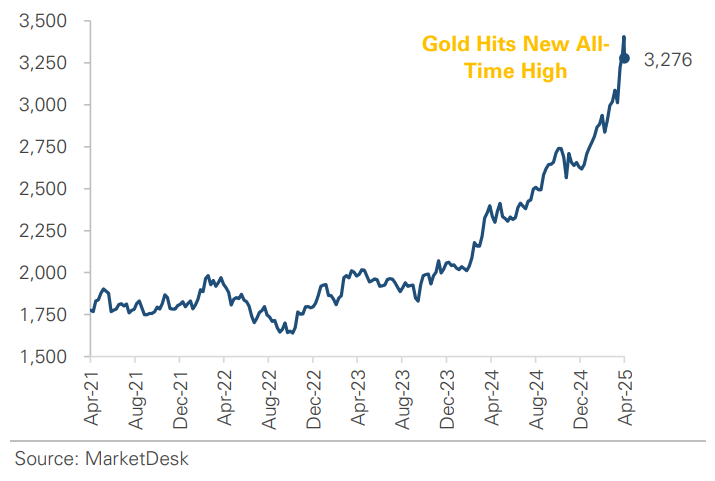
#3 - Gold Has Benefited From Macro Uncertainty
Earlier this week, prices briefly rose above $3,500 per ounce, an all-time high. The precious metal's strength has been driven by market volatility, policy uncertainty, and Trump's Fed criticism.
Implication: The flight to gold signals increased investor caution. It is telling that investors bypassed traditional safe-haven assets, such as US Treasury bonds and USD, as they sought safety.
Gold Rises To A Record High
#4 - March’s Economic Data Reveals The Early Impact of Tariffs
Consumers and businesses have pulled forward activity. Retail sales surged as consumers rushed to buy vehicles. The manufacturing index within industrial production expanded. New home sales rose to a nearly 3-year high as mortgage rates declined.
Implication: This front-loaded activity could temporarily boost Q1 GDP, but once it fades, the growth outlook becomes more uncertain and potentially weaker.
New Homes Sales Rise as Mortgage Rates Decline

#5 - Soft Survey Data Remains Weak
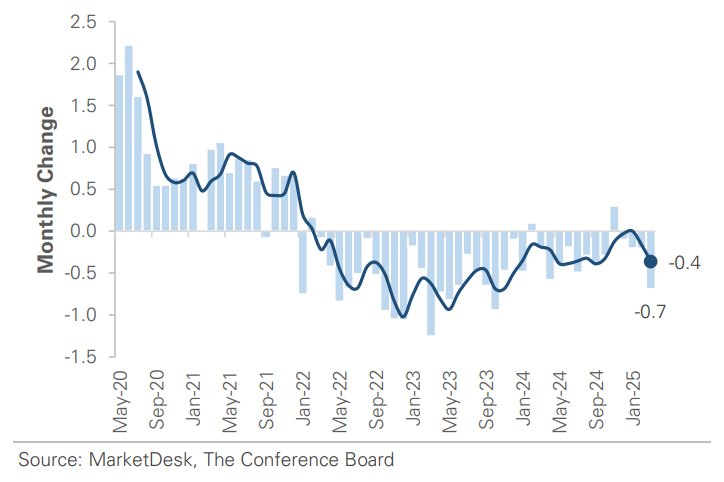
Consumer sentiment, CEO confidence, regional Fed surveys, manufacturing and services PMIs, and inflation expectations highlight the uncertainty. The Leading Economic Index declined in March, its biggest 1-month decline since October 2023.
Implication: The March hard data is backward-looking, but the soft data is forward-looking, with flashing warning signs. The risk is that hard data slows in the coming months.
Leading Economic Index Declined in March
#6 - Policy Is Driving Markets
With policy driving markets, forecasting earnings or the economy is challenging. It is unclear whether the soft data is an overreaction to uncertainty or a warning of what’s to come.
Implication: Economic and earnings fundamentals will matter again once the policy outlook stabilizes. But for now, markets are moving on headlines and speculation.
#7 - The Market Is Searching For A Bottom
Some of the signals needed for a bottom have materialized, such as capitulation, rising VIX, credit spread expansion, valuation reset, and deteriorating sentiment. The question is whether those moves have gone far enough, which will depend on the impact on the economy and earnings.
Implication: Our base case is that the market remains range-bound with elevated volatility until clarity. News volatility makes shorting the market dangerous, while technical damage and overhead resistance limit upside potential.
Important Disclosures
This material is provided for general and educational purposes only and is not investment advice. Your investments should correspond to your financial needs, goals, and risk tolerance. Please consult an investment professional before making any investment or financial decisions or purchasing any financial, securities, or investment-related service or product, including any investment product or service described in these materials.
Our Insights