Fed Holds Interest Rates Steady and Economic Data Softening

Photo Credit: Mariam Soliman, Unsplash
Weekly Market Recap for June 20th
This week, stocks ended slightly lower as markets navigated rising geopolitical tensions in the Middle East. The S&P 500 fell -1.1%, while the Russell 2000 (-1.2%) and NASDAQ (-0.7%) posted similar declines. Factor performance showed little dispersion, with Equal Weight, Growth, Value, and Momentum each down around -1%. Energy led all sectors, with oil surging by +12.4%, while defensive sectors underperformed. The Treasury yield curve modestly steepened, with rising yields weighing on long-duration Treasury bonds. Meanwhile, volatility increased in both the stock and bond markets. Overall, the market remains range-bound and directionless as it awaits further clarity on trade policy, economic growth, and the Fed’s next steps.
S&P 500 Index (Last 12 Months)

S&P 500 Technical Composite (Last 24 Months)

US Risk Demand Market Indicator
The US Risk Demand Indicator (USRDI) is a quantitative tool to measure real-time investor risk appetite. When the indicator is above zero, it signals a risk-on environment favoring cyclical sectors, high beta stocks, high-yield corporate bonds, and hybrid (convertible) bonds. In contrast, a reading below zero signals a risk-off environment favoring defensive sectors, low-volatility stocks, and U.S. Treasury bonds.

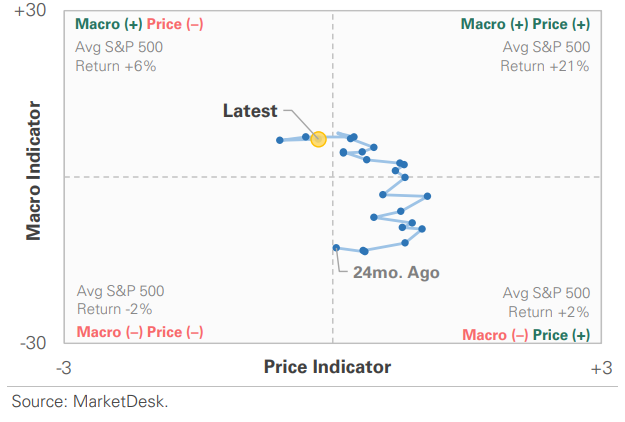
US Market Economic Cycle Indicator
The Market Cycle Indicator tracks two primary investor groups: macro investors and price-based investors. Macro investors rely on fundamental and economic data to guide their decisions, while price-based investors (or technical analysts) focus on price action, momentum, volume, and behavioral trends. The Indicator synthesizes these perspectives to identify the prevailing market regime.
S&P 500 Valuation Matrix

Key Takeaways
#1 - Lower Global Growth Forecast
Last week, the Organization for Economic Co-operation and Development (OECD), an international organization, lowered its global growth outlook for 2025 and 2026, citing mounting trade barriers, heightened US policy uncertainty, and tighter financial conditions. The organization now projects global GDP to slow from 3.3% in 2024 to 2.9% in both 2025 and 2026, down from its March 2025 forecast of 3.1% and 3.0%, respectively. The US forecast was revised to 1.6% for 2025 (down from 2.2% in March) and 1.5% for 2026 (down from 1.6%).
Implication: Global economic growth is forecast to slow more than anticipated, just a few months after it was initially projected, as the Trump administration's tariffs take effect on the US economy.
#2 - US Business Cycle Indicator Downgrade
The downgrade aligns with our US Business Cycle Indicator (USBCY), which uses macroeconomic data to objectively classify the current stage of the business cycle, which entered contraction at the end of May.
Implication: The USBCY’s current reading is significant. Historically, contraction periods have coincided with growth slowdowns (e.g., 1995 & 2015-2016) and recessions (e.g., 2001, 2008, & 2020).
US Business Cycle Indicator

Business Cycle Composite Inputs

Indexed GDP Growth Across Prior USBCY Cycles

US Stock vs Bond Returns Across Business Cycle Phases

#3 - Soft and Hard Data Indicate US Economy is Cooling
This week's soft and hard data releases indicate the US economy is cooling. Retail sales missed expectations, with a 0.9% month-over-month decline, marking the second consecutive monthly decline. Industrial production contracted for the third time in five months, marking a six-month low in year-over-year growth. In housing, homebuilder sentiment has fallen to its lowest level since December 2022, while both building permits and housing starts indicate continued weakness ahead. Meanwhile, the Citi Economic Surprise Index shows that most data have come in below expectations since mid-February.
Implication: Consumer spending is slowing, manufacturing activity remains sluggish, and housing activity continues to decelerate.
Consumer Spending Slows for a Second Consecutive Month

Industrial Production Growth Slows

NAHB Homebuilder Sentiment

US Building Permits and Housing Starts Signal Less Activity

US Economic Data Continues To Surprise To The Downside

#4 - June Fed Meeting
The Fed held its June FOMC meeting this week. As widely expected, the central bank held interest rates steady for a fourth consecutive meeting and reiterated its patient, data-dependent messaging. In his press conference, Chair Powell described the economy as solid, supported by low unemployment and steady growth. However, he cautioned that inflation remains above target with upside risk from tariffs and geopolitical tensions.
Implication: The macroeconomic backdrop is highly uncertain, and the Fed is waiting for clearer signals before taking action.
#5 - Updated Summary of Economic Projections
The Fed's June forecast showed a more cautious outlook, with GDP growth revised lower and unemployment and inflation both revised higher. While the median still indicates two rate cuts in 2025, fewer officials anticipate cuts—seven expect no cuts this year, and two anticipate just one. In addition, Fed officials forecast one fewer cut in 2026.
Implication: The big picture is the Fed is signaling a slower path to policy normalization amid persistent inflation and economic uncertainty.
Federal Reserve Summary of Economic Projections

Important Disclosures
This material is provided for general and educational purposes only and is not investment advice. Your investments should correspond to your financial needs, goals, and risk tolerance. Please consult an investment professional before making any investment or financial decisions or purchasing any financial, securities, or investment-related service or product, including any investment product or service described in these materials.
Our Insights


