Soft Labor Data, Slow Disinflation, Fed Rate Cut, and New Market Highs

Photo Credit: Ludovic Delot, Unsplash
Weekly Market Recap for December 12th
This week, the markets leaned risk-on as the Fed delivered its third consecutive rate cut and investors doubled down on the soft-landing narrative. Stocks wavered early but rallied after Wednesday’s Fed decision, with the S&P 500 and Dow moving back toward all-time highs. The Russell 2000 set record highs on consecutive days, and the equal-weight S&P 500 outperformed the broader index as leadership shifted from mega-cap growth to small caps and cyclicals. The Nasdaq and large-cap growth stocks finished the week mostly unchanged, and defensive sectors lagged. In the credit market, bonds ended the week with modest losses as Treasury yields edged higher in anticipation of the Fed pausing its rate-cutting cycle. Oil held near a four-year low, reinforcing the disinflationary tailwind, while gold hovered near record levels and Bitcoin remained volatile.
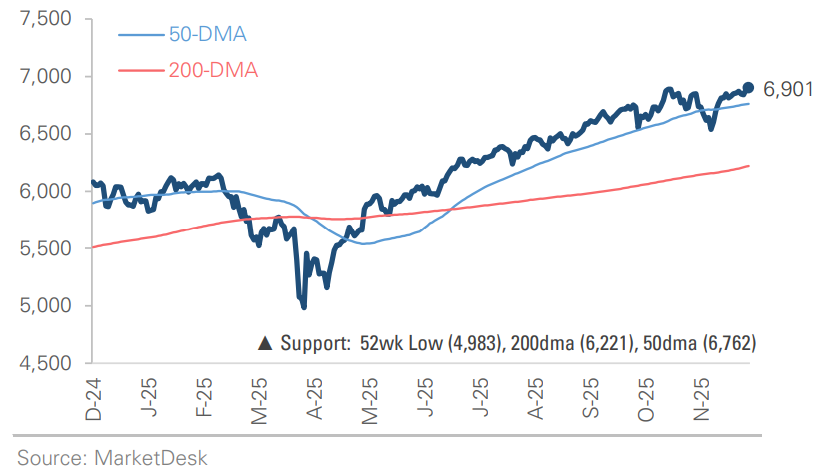
S&P 500 Index (Last 12 Months)
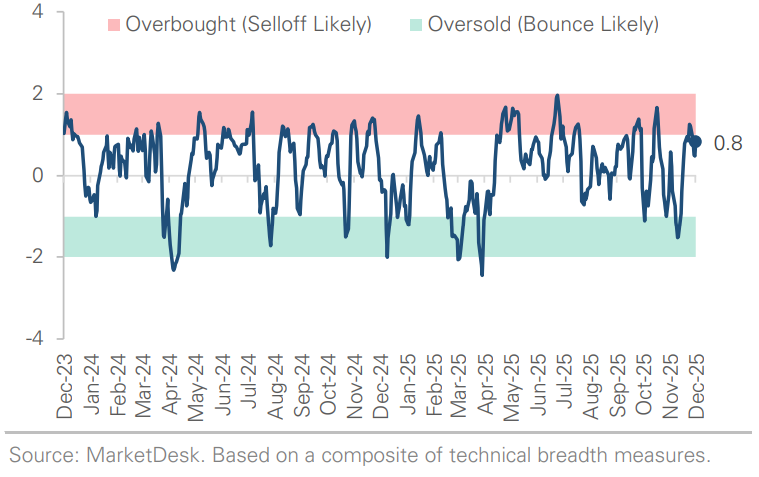
S&P 500 Technical Composite (Last 24 Months)
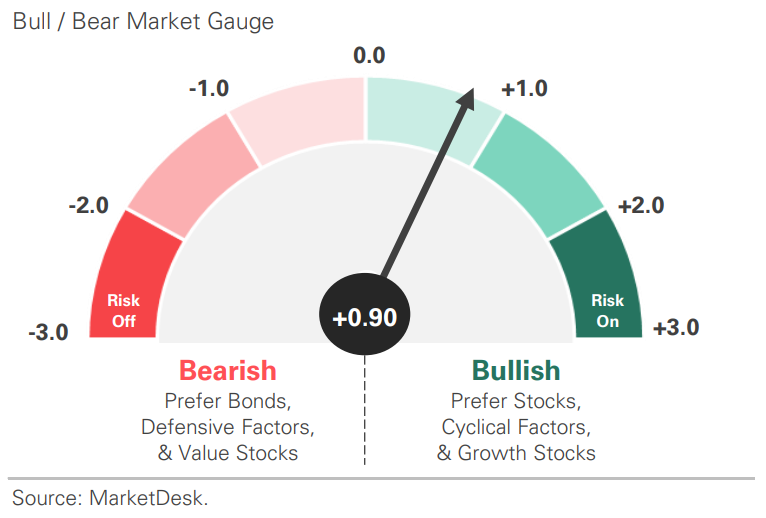
US Risk Demand Market Indicator
The US Risk Demand Indicator (USRDI) is a quantitative tool to measure real-time investor risk appetite. When the indicator is above zero, it signals a risk-on environment favoring cyclical sectors, high beta stocks, high-yield corporate bonds, and hybrid (convertible) bonds. In contrast, a reading below zero signals a risk-off environment favoring defensive sectors, low-volatility stocks, and US Treasury bonds.
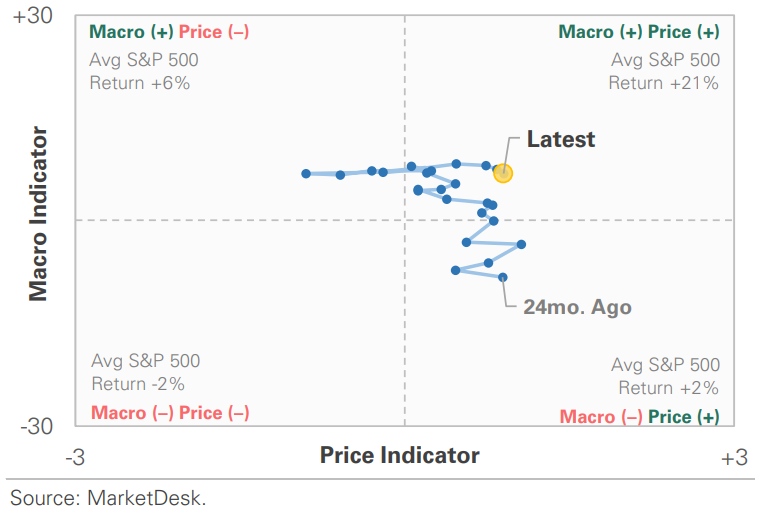
US Market Economic Cycle Indicator
The Market Cycle Indicator tracks two primary investor groups: macro investors and price-based investors. Macro investors rely on fundamental and economic data to guide their decisions, while price-based investors (or technical analysts) focus on price action, momentum, volume, and behavioral trends. The Indicator synthesizes these perspectives to identify the prevailing market regime.
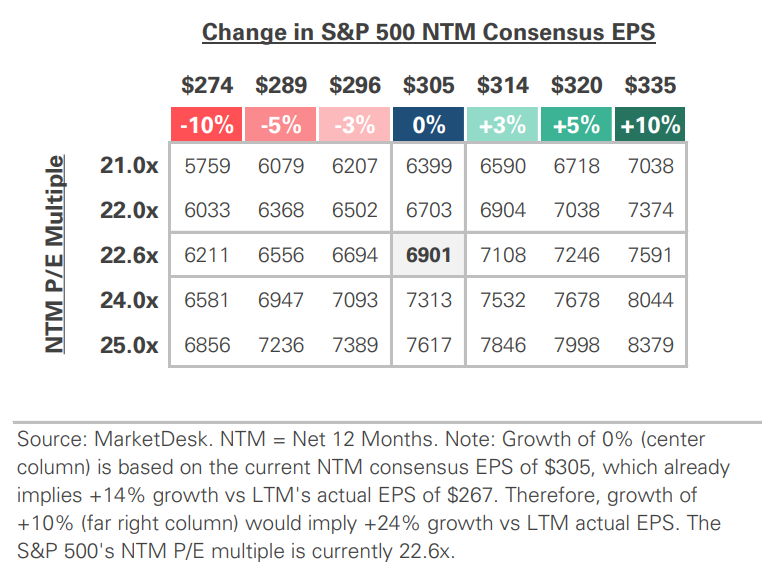
S&P 500 Valuation Matrix
S&P 500 Forward PE Ratio
The S&P 500 forward price-to-earnings (P/E) ratio is a widely followed valuation metric that compares the index's current level to the projected earnings of its constituent companies over the next 12 months. The indicator implies to investors how much they are paying today for each dollar of expected future earnings.

Key Takeaways
#1 - A Cooling Job Market?
Labor data continues to show a solid but cooling job market. Job growth and hiring are slowing, wage inflation is easing, but there is no sign of broad-based layoffs. With the shutdown delaying the official jobs report, the Fed and markets are relying on proxies such as ADP payroll data, job openings, and jobless claims.
Implication: The soft-landing narrative remains intact, but the lack of timely data is keeping macro uncertainty and event risk elevated.
Labor Market in a Low Hiring / Low Firing State

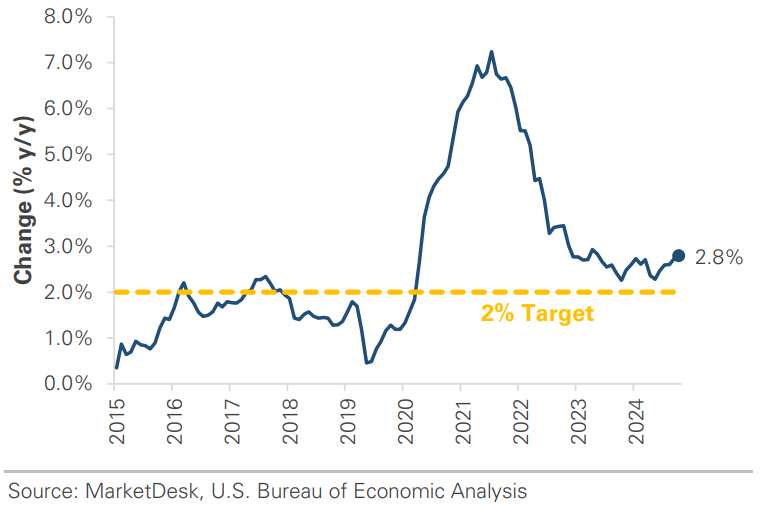
#2 - Recent Inflation Data Shows Disinflation
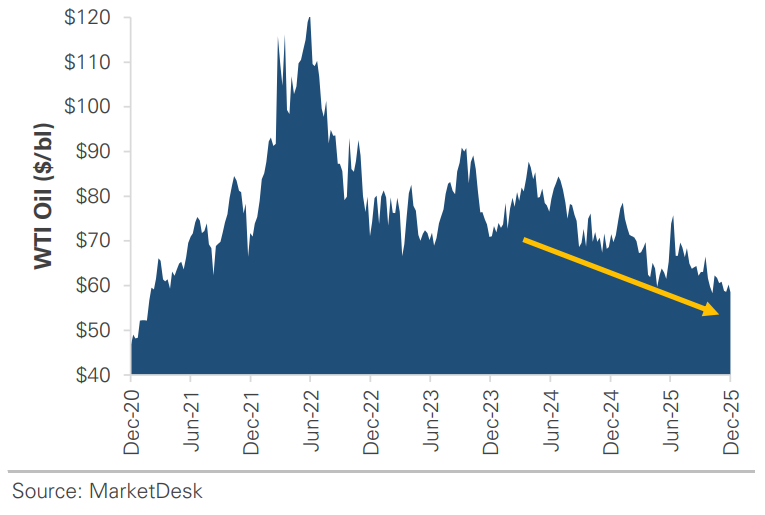
Inflation has fallen from post-pandemic highs, but it remains above the Fed’s 2% target. Surveys highlight persistent price pressures from tariffs and supply-chain shifts, and although oil trades near a 4-year low, its disinflationary impulse could reverse amid elevated geopolitical tensions.
Implication: The disinflation process continues, giving the Fed cover to cut in December, but tariff uncertainty and simmering geopolitical tensions make the disinflation story fragile.
Inflation Remains Stuck Above 2% Target
Oil Signals Disinflationary Impulse
#3 - Fed Delivers Rate Cut
The Federal Reserve delivered a widely expected 0.25% rate cut this week, its third consecutive. However, it did so in a way that framed the move as fine-tuning rather than the start of a prolonged cutting cycle. The decision was unusually divided, with a 9-3 vote that highlighted significant internal dissent, and the Federal Reserve forecasted only one cut in 2026. Chair Powell’s commentary highlighted the uncertain outlook, referencing both the soft labor market and mixed inflation data.
Implication: The Fed stopped short of calling for a rate hike, but also did not endorse the market’s forecast for two cuts in 2026. Fed officials believe they're in the right neighborhood and now want to wait to see what happens.
Fed Delivers a Third Consecutive Rate Cut

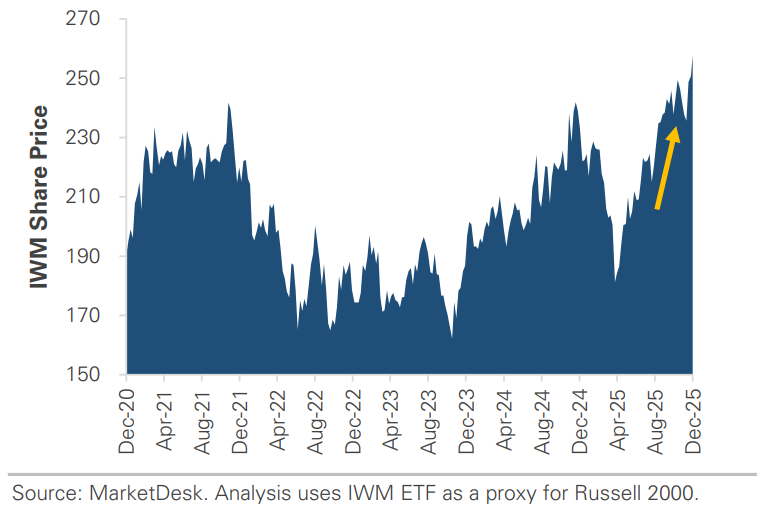
#4 - Risk-On for Markets
Markets treated the decision as a green light to take on risk, with equities rallying toward record highs. The more notable story was a broadening in market leadership from mega-cap growth toward small caps and cyclical sectors. Treasury yields declined, with the front end leading the decline, as Chair Powell pushed back against a potential rate hike, and credit spreads remained tight. Gold remained near its all-time high, signaling concern about the combination of a policy mistake, inflation, and geopolitical tensions, and Bitcoin stabilized but remained volatile.
Implication: Market pricing and investor positioning reflect high confidence in a soft landing.
Small Cap Stocks Continue to Set New Highs
#5 - A Backlog of Economic Data
JPMorgan described the U.S. consumer as “a bit more fragile,” noting households are feeling the squeeze from higher prices and fading excess savings even though credit metrics remain generally healthy. The message was less about an imminent downturn and more about a consumer whose cushion is thinner than it was a year or two ago.
Implication: Consumers are the primary driver of US economic growth, accounting for nearly 70% of economic activity. A slowdown in consumer spending could translate into slower economic growth.
Manufacturing Data Remains Sluggish

#6 - Next Week's Inflation and Jobs Report
Next week's inflation and jobs report take on outsized importance with the Fed on pause and the economic data backlog from the shutdown still clearing. The reports will help answer two key questions: (1) Is the labor market simply cooling or starting to weaken more significantly, and (2) is inflation still progressing toward the Fed's 2% target or stalling in the 3% range.
Implication: Markets have traded the story for a few weeks; now they get fresh data to test it against.
Important Disclosures
This material is provided for general and educational purposes only and is not investment advice. Your investments should correspond to your financial needs, goals, and risk tolerance. Please consult an investment professional before making any investment or financial decisions or purchasing any financial, securities, or investment-related service or product, including any investment product or service described in these materials.
Our Insights