Q4 GDP Growth, Tariff Uncertainty, Fed Rate Cuts, and AI Developments

Photo Credit: Getty Images, Unsplash
Weekly Market Recap for February 27th
This week, markets rebounded from an early-week sell-off tied to tariff uncertainty but finished the week little changed. The performance gap was narrow, with the Nasdaq, S&P 500, equal-weight S&P 500, Russell 2000, and Dow all flat to slightly lower. Defensive sectors led, with Consumer Staples and Utilities outperforming, while Industrials and Consumer Discretionary lagged. Treasury yields extended their multi-week decline, with the 10-year falling to ~4.00%, the lowest since November. Longer-maturity bonds outperformed, and investment-grade outperformed high-yield. International stocks continued to outperform U.S. stocks, led by emerging markets. Gold gained +3%, extending its strong 12-month performance, while oil pulled back after last week’s geopolitical spike. The VIX briefly rose above 21 on Monday before falling back to 19.
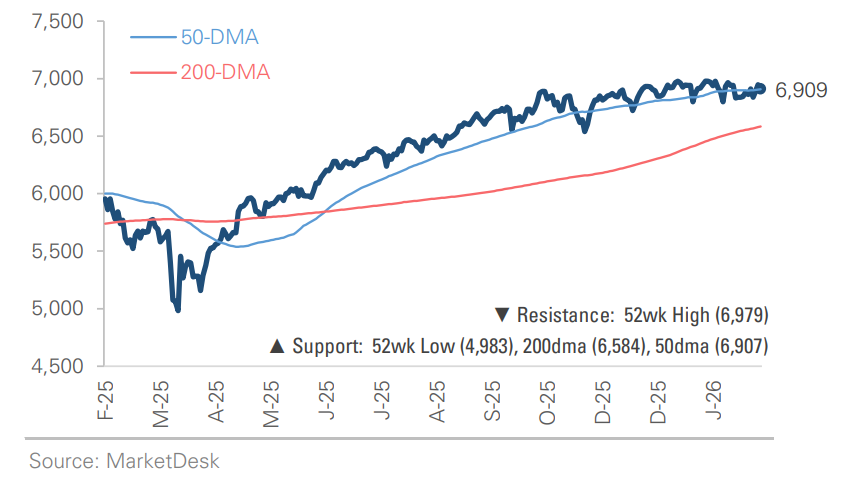
S&P 500 Index (Last 12 Months)
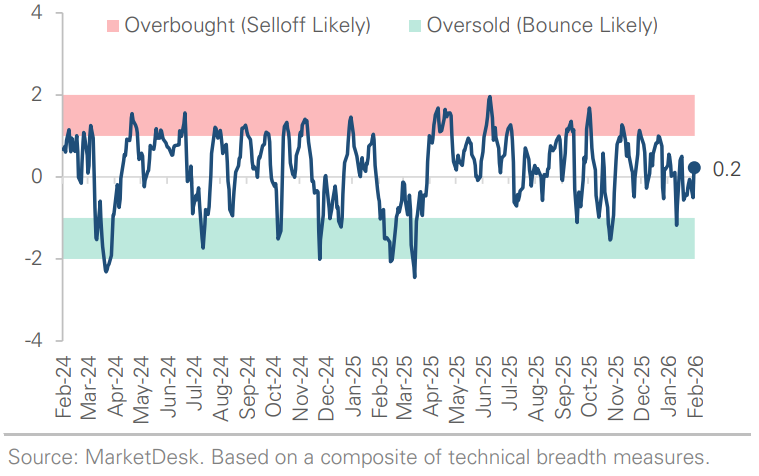
S&P 500 Technical Composite (Last 24 Months)
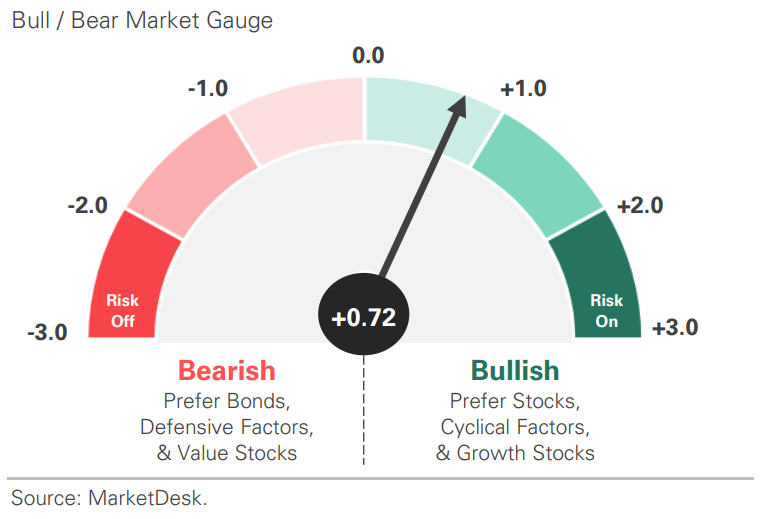
US Risk Demand Market Indicator
The US Risk Demand Indicator (USRDI) is a quantitative tool to measure real-time investor risk appetite. When the indicator is above zero, it signals a risk-on environment favoring cyclical sectors, high beta stocks, high-yield corporate bonds, and hybrid (convertible) bonds. In contrast, a reading below zero signals a risk-off environment favoring defensive sectors, low-volatility stocks, and US Treasury bonds.
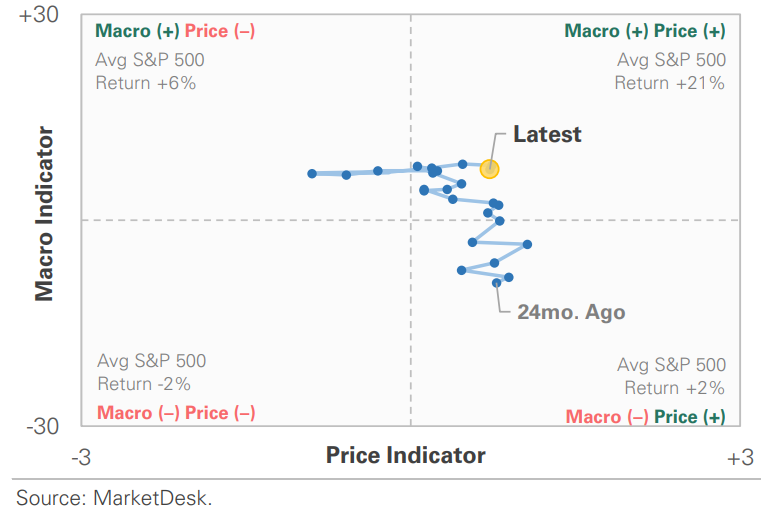
US Market Economic Cycle Indicator
The Market Cycle Indicator tracks two primary investor groups: macro investors and price-based investors. Macro investors rely on fundamental and economic data to guide their decisions, while price-based investors (or technical analysts) focus on price action, momentum, volume, and behavioral trends. The Indicator synthesizes these perspectives to identify the prevailing market regime.
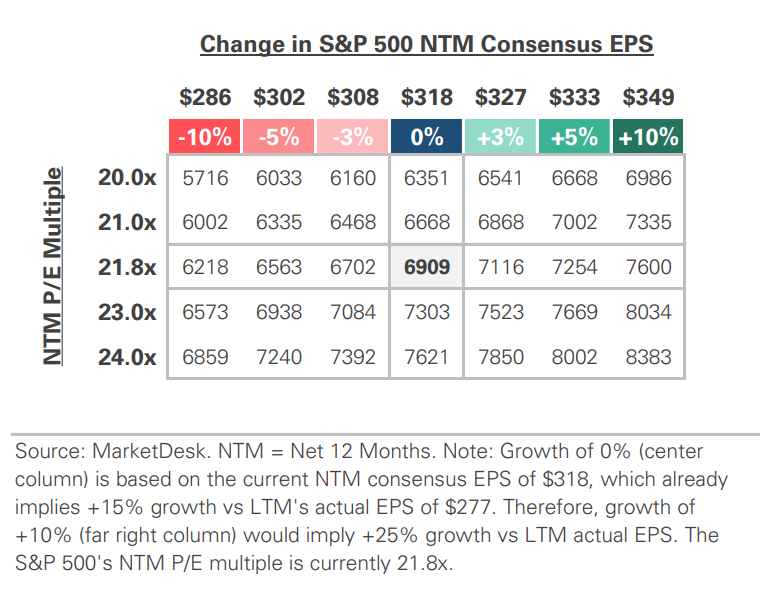
S&P 500 Valuation Matrix
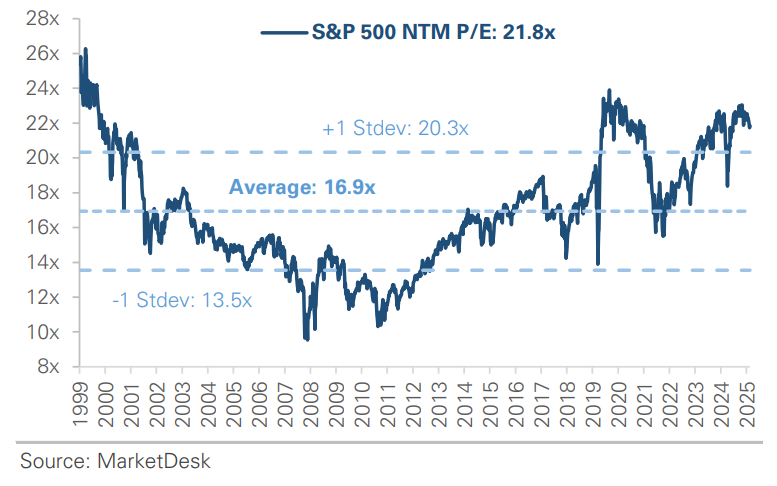
S&P 500 Forward PE Ratio
The S&P 500 forward price-to-earnings (P/E) ratio is a widely followed valuation metric that compares the index's current level to the projected earnings of its constituent companies over the next 12 months. The indicator implies to investors how much they are paying today for each dollar of expected future earnings.
Key Takeaways
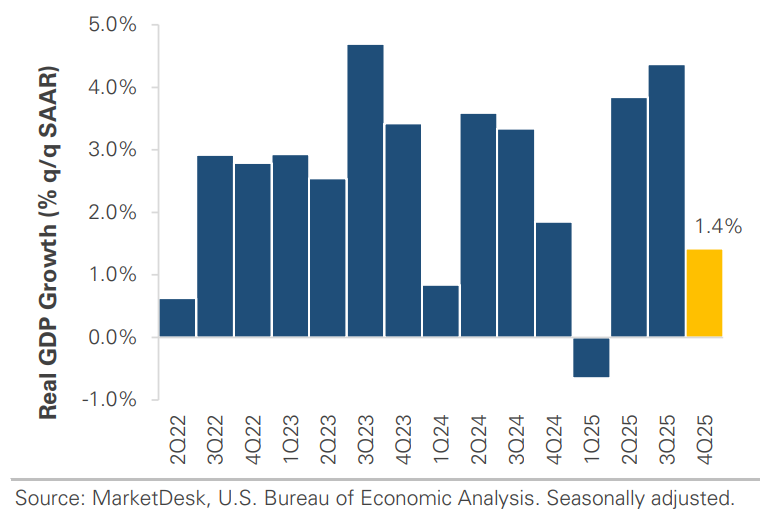
#1 - Government Shutdown Weighs on Economic Growth
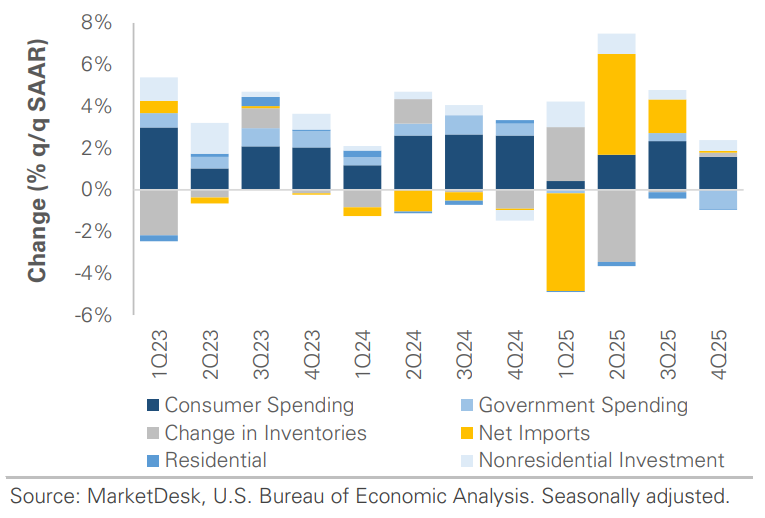
Fourth-quarter GDP grew at a +1.4% annualized pace, down from +4.4% in Q3. The growth slowdown was tied to the six-week government shutdown, which reduced federal spending and subtracted ~1% from growth. Excluding the drag, growth would have been closer to +2.4%. Core measures of GDP, which exclude volatile categories such as government spending, inventory stocking, and net exports, also rose by 2.4%, showing the core economy continues to expand at a solid pace.
Implication: The headline GDP print looked alarming, but the story was more nuanced. The overall economy remains solid, and the drag from the shutdown could reverse in Q1 as federal spending normalizes.
Government Shutdown Weighed on Economic Growth
Contribution to Q4 2025 GDP Growth
#2 - Tariff Uncertainty Rattles Markets
Stocks rallied after the Supreme Court struck down the administration’s tariff authority, a decision the market viewed as a meaningful reduction in policy risk. However, the relief was short-lived, as the administration announced a new 10% tariff under a different legal framework, triggering an early-week sell-off. Stocks stabilized and rebounded later in the week, suggesting the market is becoming accustomed to tariff headlines.
Implication: The question is whether the shift represents a true easing of trade risk or simply a new version of the same uncertainty. The takeaway: trade policy is likely to remain in the headlines.
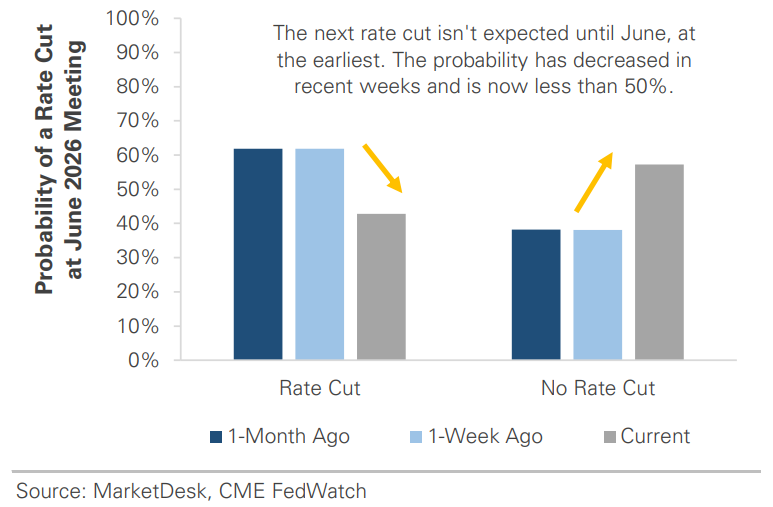
#3 - Rate Cut Expectations Keep Getting Pushed Back
The market continues to push back the timing of the next Federal Reserve rate cut, with a September cut now removed from the base case and June looking more like a coin flip. Sticky inflation data, hawkish Fed meeting minutes and commentary, and renewed tariff uncertainty have reinforced the view that policymakers are in no rush to lower rates.
Implication: The market still expects the Fed to cut rates twice this year, but the start date keeps slipping. The question is when the Fed will cut, not whether it will return to hiking rates.
Probability of a June Rate Cut is a Coin Flip
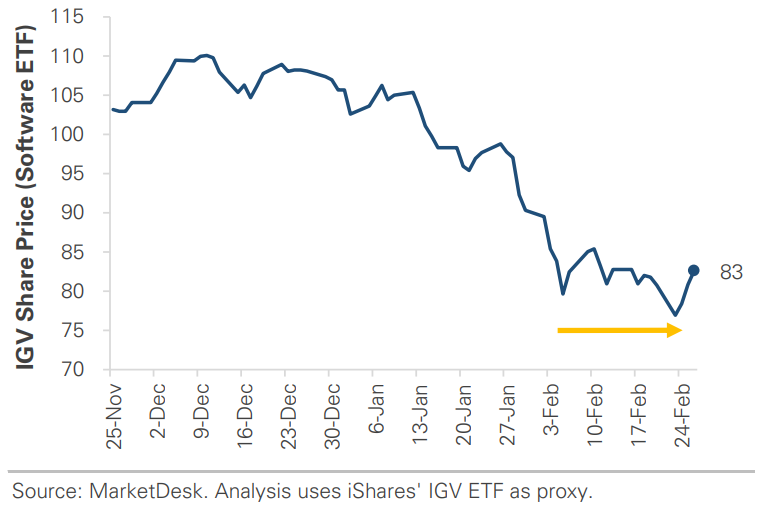
#4 -AI Headlines Continue to Spark Market Swings
The market continued to digest AI-related headlines this week, with Anthropic’s announcement of new AI tools raising fears of disruption in legacy software and consulting. Sentiment shifted midweek after Anthropic emphasized that its tools are designed to work alongside existing platforms, and Nvidia reported strong earnings and revenue guidance tied to continued demand for AI infrastructure.
Implication: This week reinforced AI as a major investment theme, while also highlighting the unknowns: how it will transform business models, and to what extent stock prices already reflect concerns about AI disruption and expectations for continued AI infrastructure investment.
Software Stocks Stabilize After AI-Driven Sell-Off
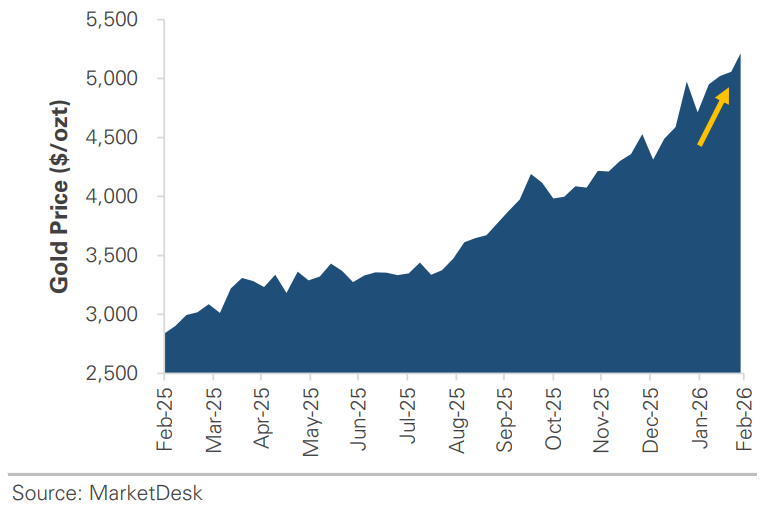
Gold Rebounds After Early-Month Sell-Off
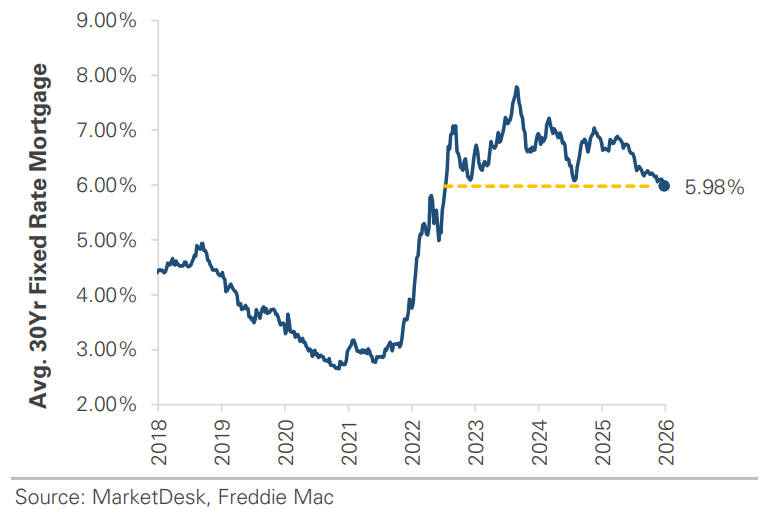
#5 - Mortgage Rates Fall to Multi-Year Lows
This week, the average 30-year fixed mortgage rate fell below 6% for the first time since September 2022. The move follows a decline in Treasury yields driven by easing inflation and a flight to safety amid market volatility, amid concerns that AI could disrupt current business models.
Implication: Lower rates improve affordability, create refinancing opportunities for some homeowners, and reduce the “lock-in effect.” However, while financing conditions are improving, elevated home prices and limited inventory mean this is a step toward stabilization, not a complete reset for the housing market.
Average 30-Year Mortgage Rate Falls Below 6%
Important Disclosures
This material is provided for general and educational purposes only and is not investment advice. Your investments should correspond to your financial needs, goals, and risk tolerance. Please consult an investment professional before making any investment or financial decisions or purchasing any financial, securities, or investment-related service or product, including any investment product or service described in these materials.
Our Insights