AI Selloff Pauses, Economic Data Surprise to the Upside, Fed Meeting Minutes, and Rising Oil Prices

Photo Credit: Getty Images, Unsplash
Weekly Market Recap for February 20th
This week, markets stabilized as the AI-driven stress that dominated the prior two weeks began to ease. The S&P 500 and Nasdaq posted modest gains, with growth stocks outperforming value for the first time in five weeks. Financials and technology, two of the sectors hit hardest during the selloff, rebounded, while last week’s defensive leaders, including utilities and consumer staples, gave back some of their gains. Volatility cooled, with the VIX briefly falling below 20, and high-yield credit spreads tightened, signaling improved risk appetite. Treasury yields ticked higher after the FOMC minutes revealed that some officials discussed the possibility of rate hikes, pausing a multi-week rally that had driven yields higher. International stocks traded sideways as the U.S. dollar strengthened. Oil surged midweek amid escalating geopolitical tensions, gold traded lower amid a volatile week, and bitcoin extended its multi-month decline.
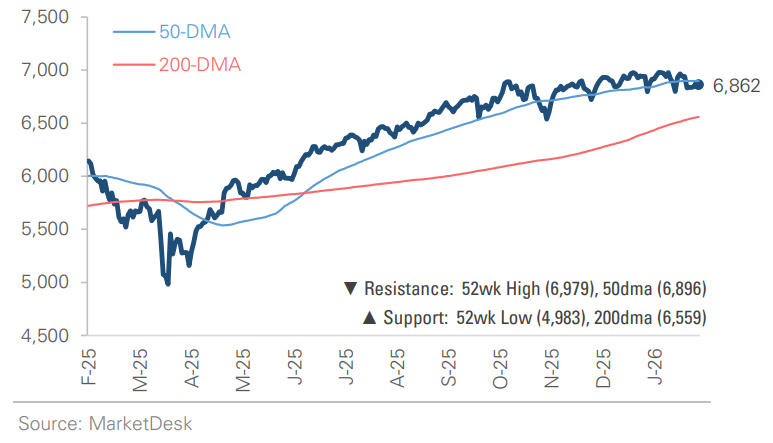
S&P 500 Index (Last 12 Months)
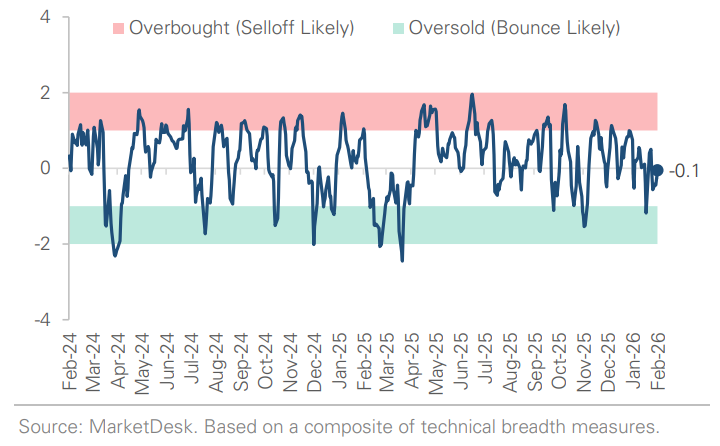
S&P 500 Technical Composite (Last 24 Months)
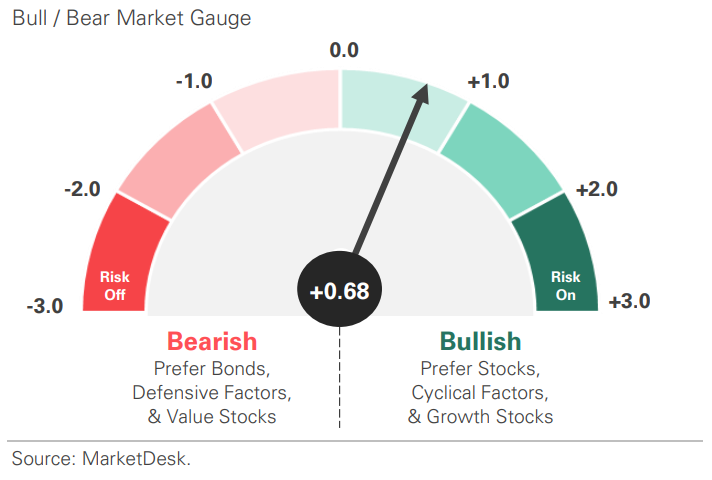
US Risk Demand Market Indicator
The US Risk Demand Indicator (USRDI) is a quantitative tool to measure real-time investor risk appetite. When the indicator is above zero, it signals a risk-on environment favoring cyclical sectors, high beta stocks, high-yield corporate bonds, and hybrid (convertible) bonds. In contrast, a reading below zero signals a risk-off environment favoring defensive sectors, low-volatility stocks, and US Treasury bonds.
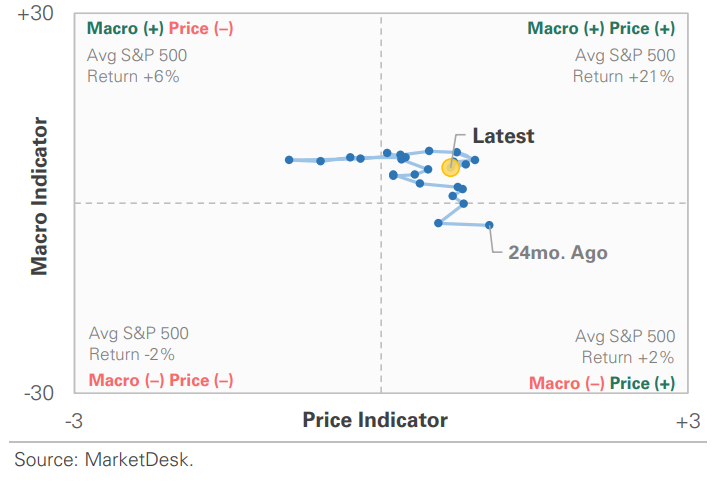
US Market Economic Cycle Indicator
The Market Cycle Indicator tracks two primary investor groups: macro investors and price-based investors. Macro investors rely on fundamental and economic data to guide their decisions, while price-based investors (or technical analysts) focus on price action, momentum, volume, and behavioral trends. The Indicator synthesizes these perspectives to identify the prevailing market regime.
S&P 500 Valuation Matrix
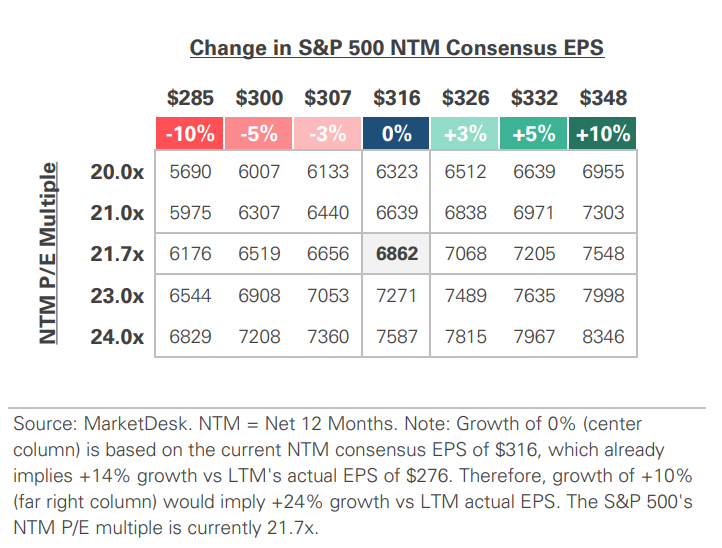
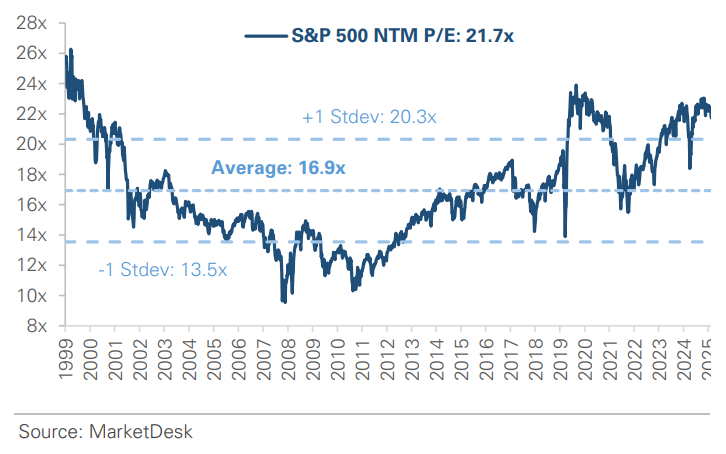
S&P 500 Forward PE Ratio
The S&P 500 forward price-to-earnings (P/E) ratio is a widely followed valuation metric that compares the index's current level to the projected earnings of its constituent companies over the next 12 months. The indicator implies to investors how much they are paying today for each dollar of expected future earnings.
Key Takeaways
#1 - The AI Disruption Trade Pauses
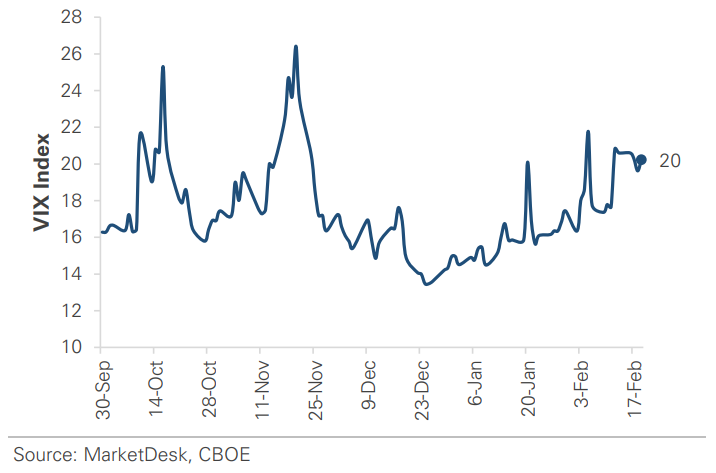
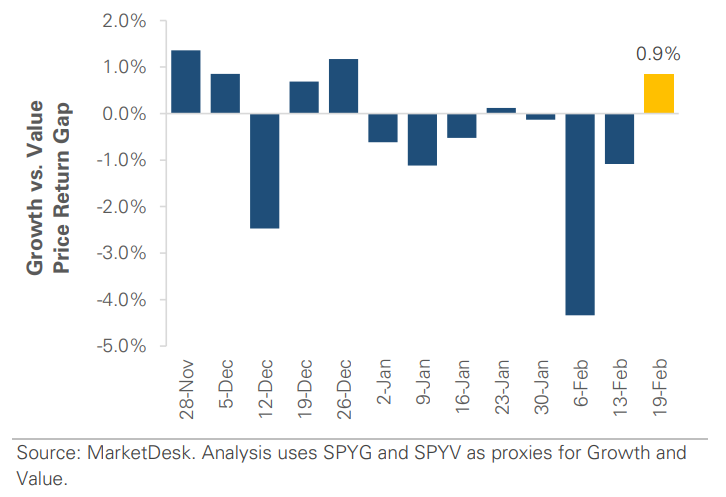
Markets stabilized this week after two volatile, AI-driven selloff weeks, with calmer trading across equities, rates, and credit. Volatility eased as the VIX fell below 20, credit spreads tightened, and the most pressured areas of the market, including the growth factor, technology, and financial sectors, as well as high-beta stocks, stabilized after multi-week declines. The key catalyst was Meta’s partnership with Nvidia, which shifted the AI narrative from fears of disruption to real-world infrastructure investment and clearer winners. Strong economic data also provided reassurance, reinforcing the market’s risk-on tone.
Implication: This week’s calmer tone is a positive sign, as the market steps back from recent volatility and begins to differentiate between AI risks and opportunities.
Volatility Remains Elevated But Stabilizes
Growth Outperforms Value as Tech Selloff Pauses
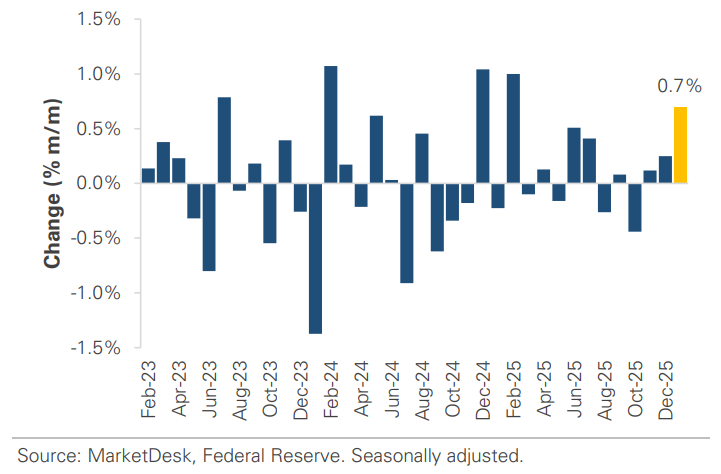
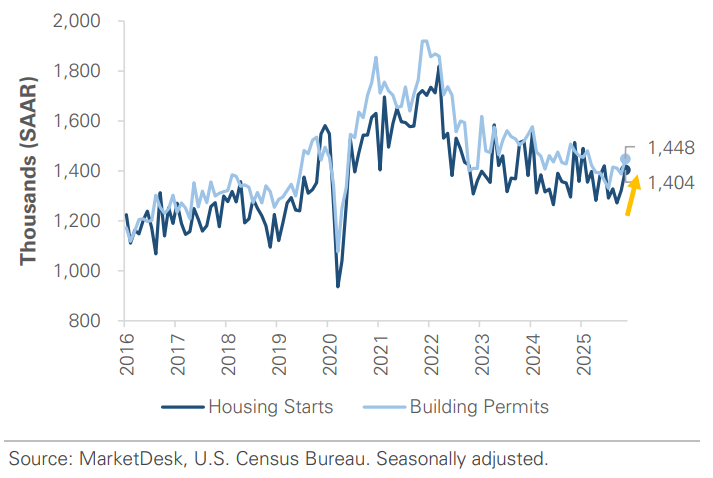
#2 - Manufacturing and Housing Data Surprise to the Upside
A wave of stronger-than-expected economic data hit this week, suggesting overall economic activity remains solid. Industrial production expanded +0.7% in January, while housing starts and building permits both came in above forecast for December, signaling improving residential construction activity. Orders for durable goods, items with expected lives of more than 3 years, were mixed on the surface, but excluding volatile categories like aircraft, core business investment measures strengthened, suggesting companies continue to spend on equipment and technology.
Implication: Many of the releases were delayed by last year’s government shutdown, resulting in multiple months of backlogged data arriving at once. While the data reflects late-2025 conditions, it suggests the economy ended the year on a stronger note than feared.
Industrial Production Signals Manufacturing Expansion
Housing Data Points to Improving Activity
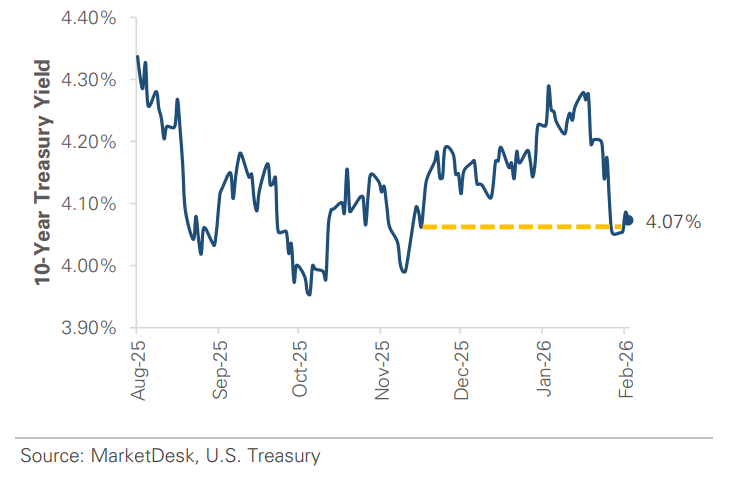
#3 - Treasury Yields Rise After Multi-Week Decline
Treasury yields rose this week after the Fed’s January meeting minutes struck a more hawkish tone, with some officials discussing the possibility of rate hikes if inflation remains above target. The 10-year yield rose to 4.09%, pausing a multi-week decline that had pulled it down almost -0.25%. The move was reinforced by this week’s stronger-than-expected economic data and soft demand at a 20-year Treasury auction, both of which added to the pressure.
Implication: Markets continue to price limited odds of a near-term rate cut, with expectations shifting toward mid-2026. While a few policymakers emphasized inflation risks, the market’s base case is that the next move is lower, not higher.
US 10-Year Treasury Yield Sits at a 2.5 Month Low
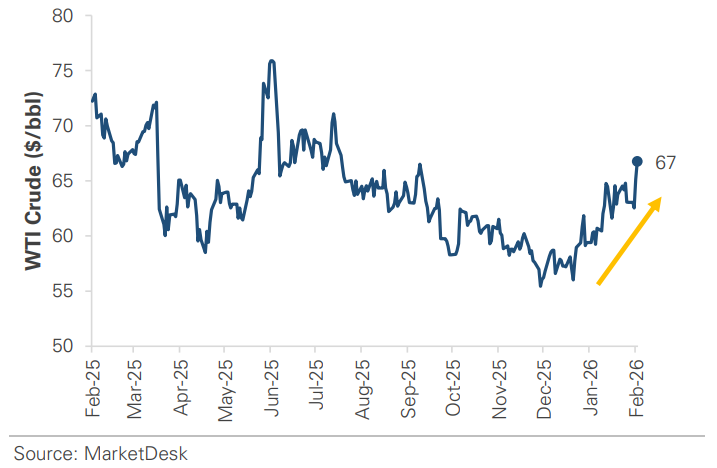
#4 -Oil Prices Rise as Geopolitical Risk Escalates
Geopolitical tensions pushed oil higher this week, as renewed tensions between the U.S. and Iran added a fresh risk premium to energy markets. Crude prices surged nearly +4.5% in a single session, with WTI trading above $66 for the first time since early August. The catalyst was a combination of stalled diplomatic progress and concerns around the Strait of Hormuz, a critical route for global oil shipments.
Implication: While there’s been no major supply disruption, markets tend to react quickly when risks involve key producing regions and transit chokepoints. If oil prices remain elevated, they could add to inflation pressures, impact the pace of future rate cuts, and weigh on consumer sentiment.
Geopolitical Tensions Push Oil to August 2025 Levels
Important Disclosures
This material is provided for general and educational purposes only and is not investment advice. Your investments should correspond to your financial needs, goals, and risk tolerance. Please consult an investment professional before making any investment or financial decisions or purchasing any financial, securities, or investment-related service or product, including any investment product or service described in these materials.
Our Insights


