Interest Rates Rise, Oil Prices Fall Below $100, and Nvidia Reports Strong Earnings

Photo Credit: Greg Bulla, Unsplash
Weekly Market Recap for May 22nd
This week, the pace of the rally slowed this week as markets reacted to a combination of headlines. Stocks traded lower early in the week as Treasury yields climbed to multi-decade highs, raising concerns about increased borrowing costs and pressuring stock market valuations. However, sentiment improved after reports of potential progress in negotiations with Iran pushed oil prices back below $100 per barrel and stabilized interest rates. The S&P 500 ended the week with a modest loss, breaking its multi-week winning streak, and the Nasdaq traded lower as the tech sector’s rally slowed. Energy and defensive sectors outperformed the broad market index, while cyclical sectors like materials and industrials underperformed. Bonds traded lower as interest rates continued to rise, and the VIX sits near levels seen in late January despite equity market volatility.
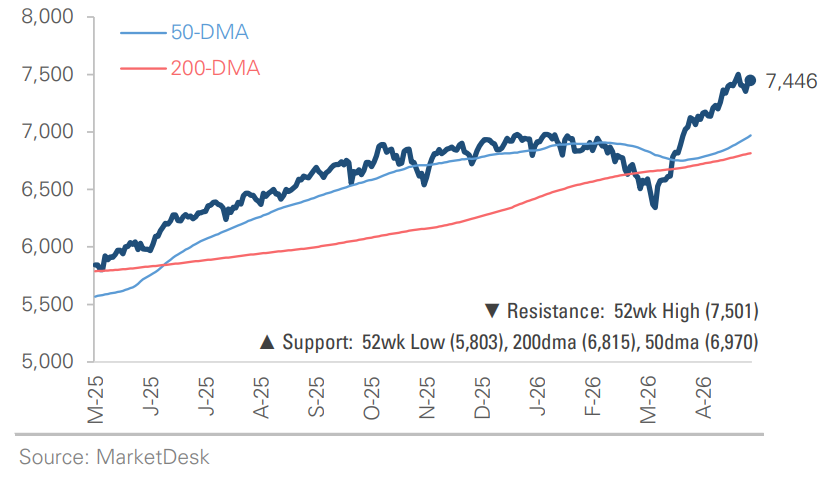
S&P 500 Index (Last 12 Months)
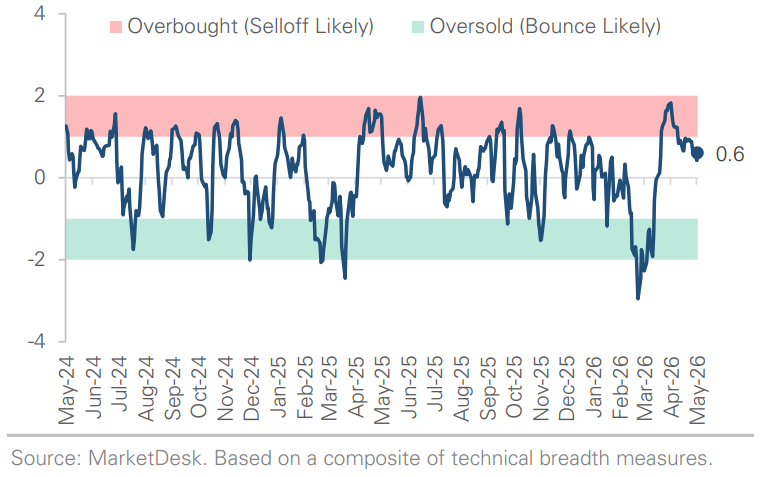
S&P 500 Technical Composite (Last 24 Months)
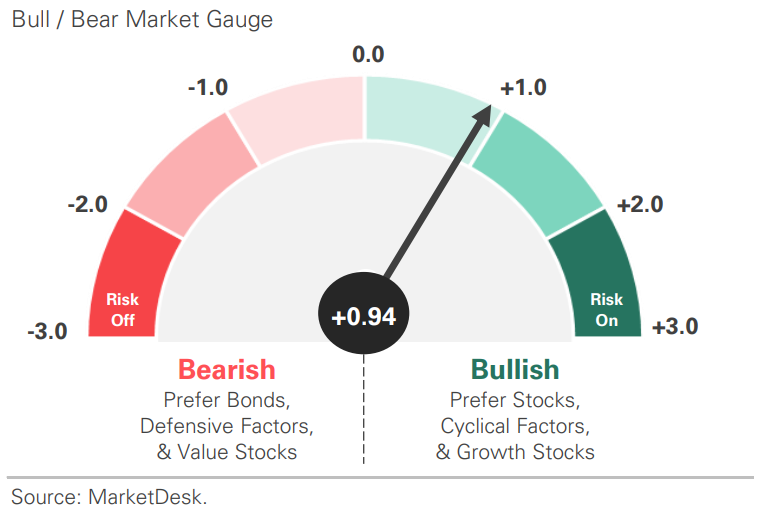
US Risk Demand Market Indicator
The US Risk Demand Indicator (USRDI) is a quantitative tool to measure real-time investor risk appetite. When the indicator is above zero, it signals a risk-on environment favoring cyclical sectors, high beta stocks, high-yield corporate bonds, and hybrid (convertible) bonds. In contrast, a reading below zero signals a risk-off environment favoring defensive sectors, low-volatility stocks, and US Treasury bonds.
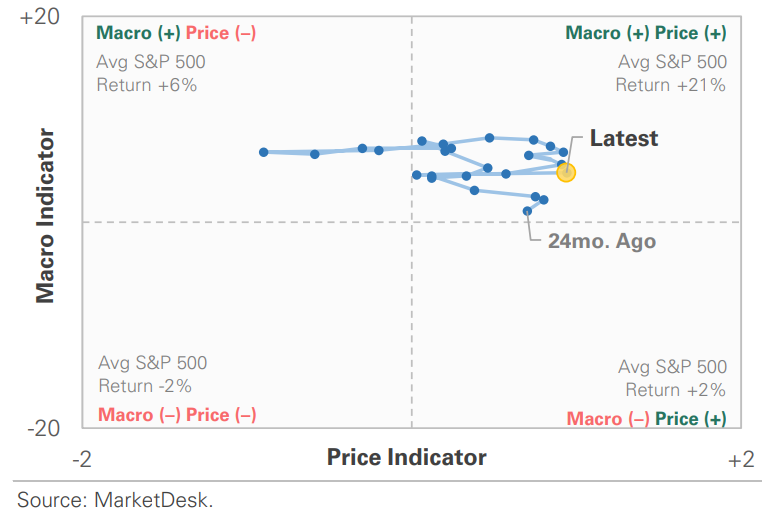
US Market Economic Cycle Indicator
The Market Cycle Indicator tracks two primary investor groups: macro investors and price-based investors. Macro investors rely on fundamental and economic data to guide their decisions, while price-based investors (or technical analysts) focus on price action, momentum, volume, and behavioral trends. The Indicator synthesizes these perspectives to identify the prevailing market regime.
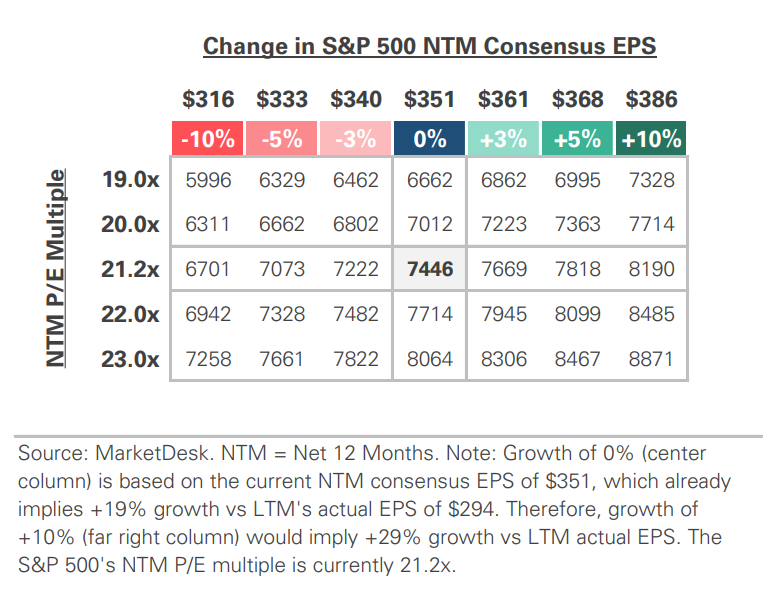
S&P 500 Valuation Matrix
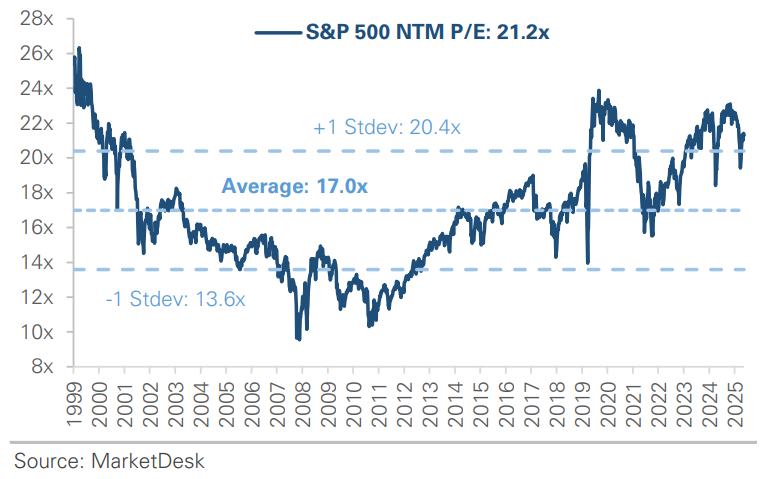
S&P 500 Forward PE Ratio
The S&P 500 forward price-to-earnings (P/E) ratio is a widely followed valuation metric that compares the index's current level to the projected earnings of its constituent companies over the next 12 months. The indicator implies to investors how much they are paying today for each dollar of expected future earnings.
Key Takeaways
#1 - Interest Rates Rise
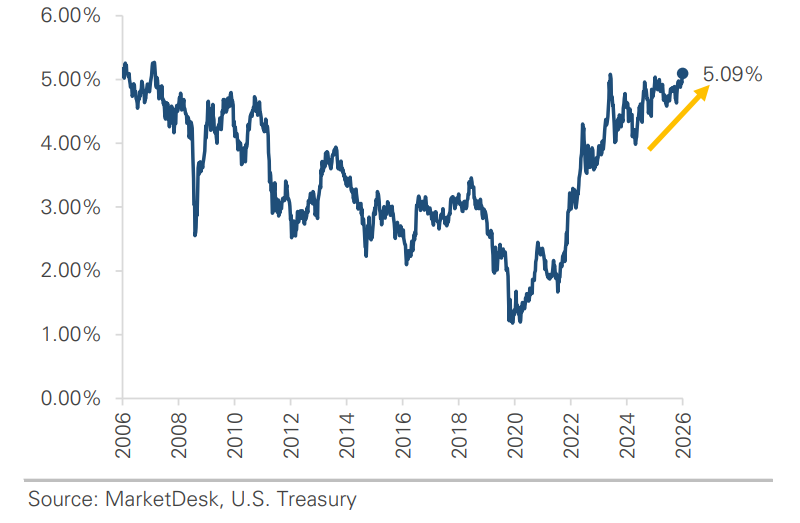
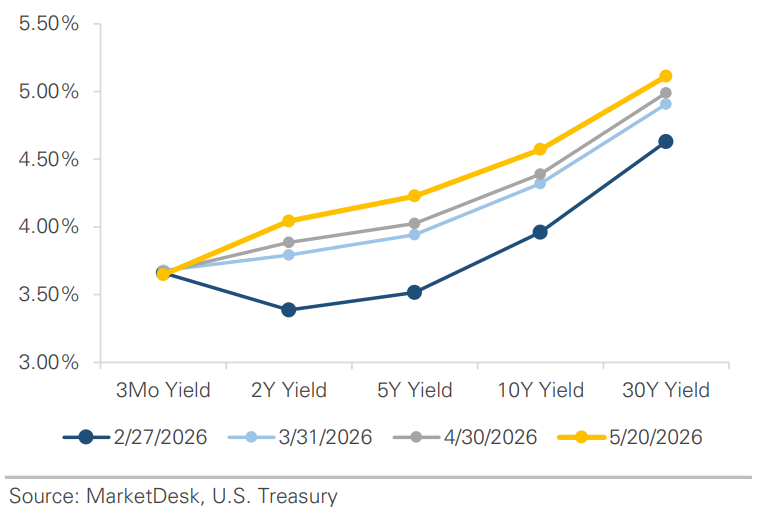
Interest rates rose this week, extending a trend that started in late February. The 30-year Treasury yield touched 5.19% on Tuesday, its highest in nearly 19 years. The entire interest rate curve continued to shift higher, with the 2-year and 5-year Treasury yields each rising for a second straight week. This week’s rise built on last week’s move higher in interest rates, which began after hot inflation prints raised concerns about inflationary pressures.
Implication: Multiple themes have combined to push interest rates higher, including rising oil prices, Fed commentary about potential rate hikes, and recent inflation data. Interest rates are currently at multi-decade highs, and the market is monitoring the potential for another leg higher.
30-Year Treasury Yield Rises to 2006 Levels
Treasury Yield Curve Continues to Shift Higher
#2 - Fed Minutes Indicate Rates May Remain Higher
Minutes from the Fed’s April meeting reinforced that interest rates may remain higher for longer. The meeting included several dissents, and multiple officials stated a desire to remove the rate-cutting bias. The message was clear: rate hikes are a possibility. Investors had already started to lower expectations for rate cuts, and while the market expects the Fed to hold rates steady across the next three meetings, it now expects the central bank to raise rates at either the October or December meeting.
Implication: The Fed’s next meeting takes place in mid-June. The setup: the conversation has shifted from when the Fed will cut rates to whether it should raise rates.
#3 - Stocks Rebound
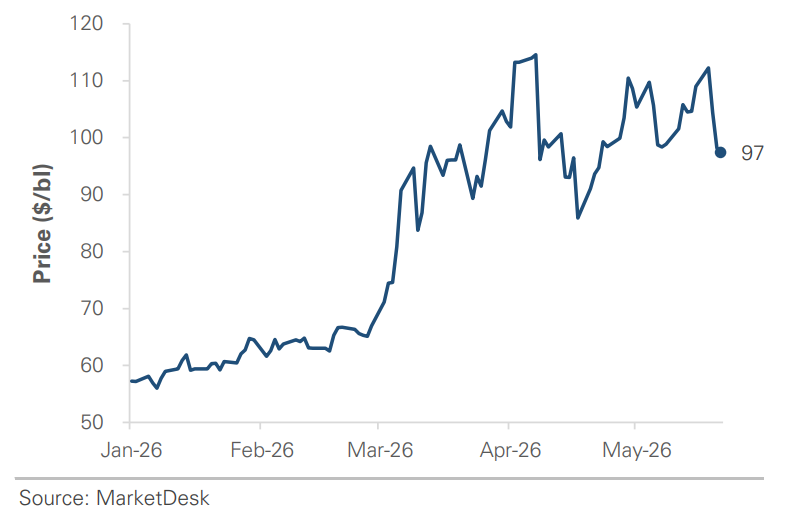
Stocks rebounded midweek as reports of easing tensions with Iran pushed oil prices lower and boosted investor sentiment. Crude oil prices, which have spiked on geopolitical concerns, fell from near $110 to below $100. The decline in oil prices helped ease fears that higher energy costs could add to inflation pressures and keep interest rates elevated. Stocks responded positively as interest rates fell, with the S&P 500 and Nasdaq trading back toward record highs and the Dow briefly rising back above 50,000.
Implication: The midweek reversal showed how closely investors are watching developments in the Middle East and interest rate movements, with both likely to influence markets in the near term.
Geopolitical Headlines Continue to Drive Oil Prices
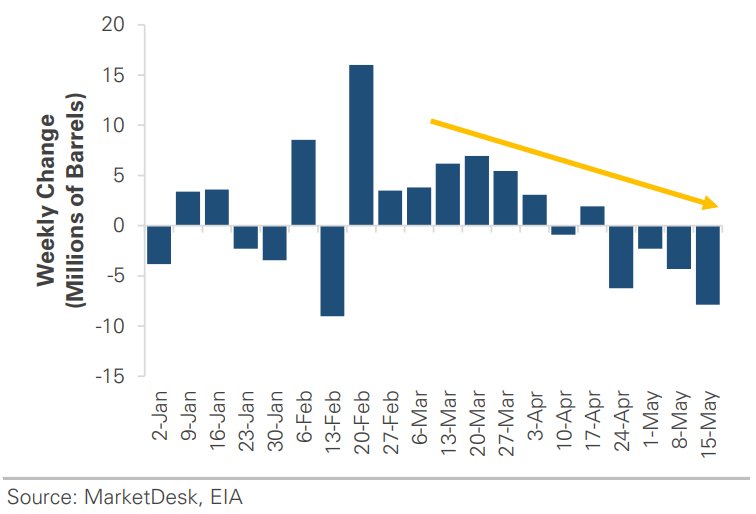
Crude Oil Inventories Continue to Be Drawn Down
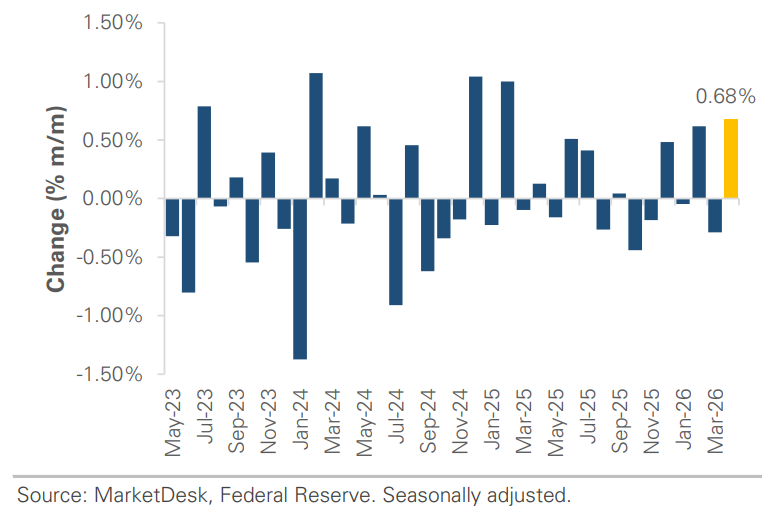
Industrial Production Continues to Expand
#4 -Largest Stocks Continue to Lead
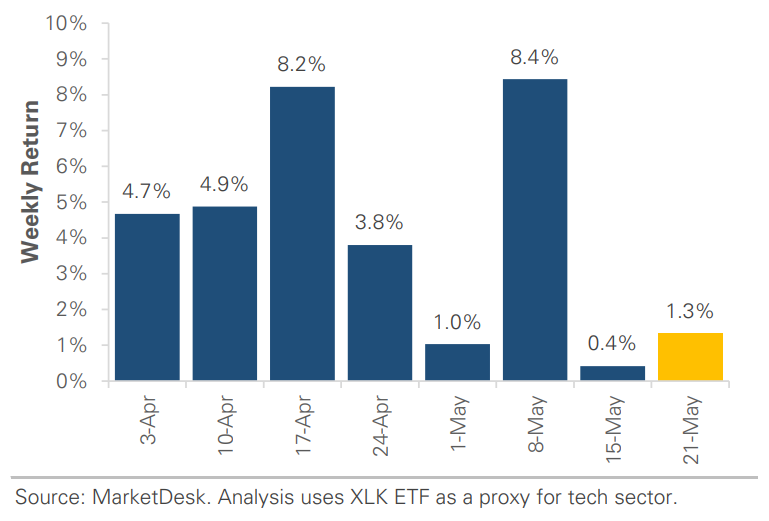
The largest stocks continued to lead the market, helping the S&P 500 rebound and remain near a record high despite rising interest rates. Technology stocks have driven most of the gains since late March, with strong momentum in AI-related stocks. While most of the market has participated in the rally, leadership has narrowed in recent weeks. Interest rate-sensitive groups, such as small caps, have traded lower as rising interest rates weigh on the broader market.
Implication: Major stock indexes remain near all-time highs, but the rally is slowing and becoming more selective as markets digest the strong gains since late March.
#5 - Nvidia’s Earnings Release
NVIDIA’s earnings release was this week’s big event. Investors track its results as an important measure of AI-related technology demand. The chipmaker reported ~$81.6 billion in revenue, up roughly +85% from a year earlier, along with strong earnings and an $80 billion buyback.
Implication: The earnings report indicates that spending on AI infrastructure remains strong and continues to grow. At the same time, expectations for Nvidia and the broader AI industry are already high, meaning companies will need to continue delivering strong results to meet rising estimates.
Pace of Tech Sector Rally Slows
Important Disclosures
This material is provided for general and educational purposes only and is not investment advice. Your investments should correspond to your financial needs, goals, and risk tolerance. Please consult an investment professional before making any investment or financial decisions or purchasing any financial, securities, or investment-related service or product, including any investment product or service described in these materials.
Our Insights


