Inflation Surprises to the Upside, Rates Rise, and Stocks Set New Highs

Photo Credit: Roberta Sant Anna, Unsplash
Weekly Market Recap for May 15th
This week, markets traded higher for a seventh consecutive week, extending the rally from late March. The S&P 500 and Nasdaq continued to set new all-time highs, but the rally remained narrow, with small-cap stocks and the equal-weight S&P 500 posting only modest gains. Technology remained the strongest sector, and the gains in the largest tech companies pulled the broader index and growth factor higher. The week’s defining story was inflation, with both consumer and producer prices rising at the fastest pace in years. Treasury bonds fell as interest rates rose, while corporate bonds outperformed as credit spreads tightened. Oil prices climbed as tensions in the Middle East re-escalated, and international stocks again underperformed U.S. stocks. Next week’s big event is Nvidia’s earnings report, which will provide further insight into AI capex.
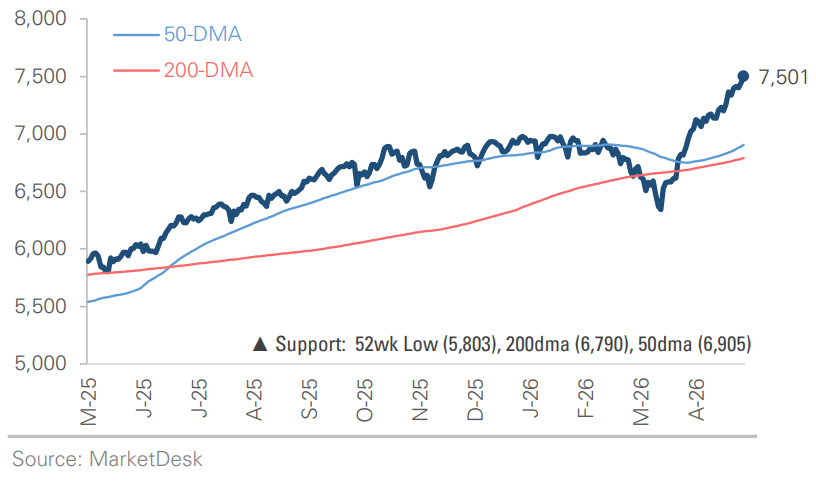
S&P 500 Index (Last 12 Months)
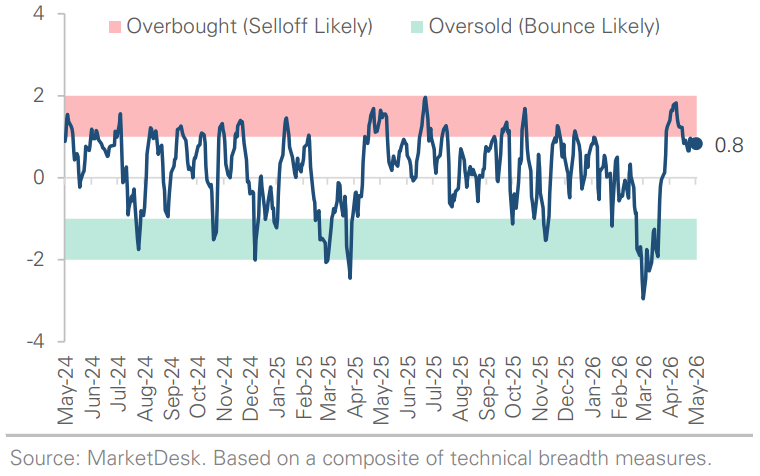
S&P 500 Technical Composite (Last 24 Months)
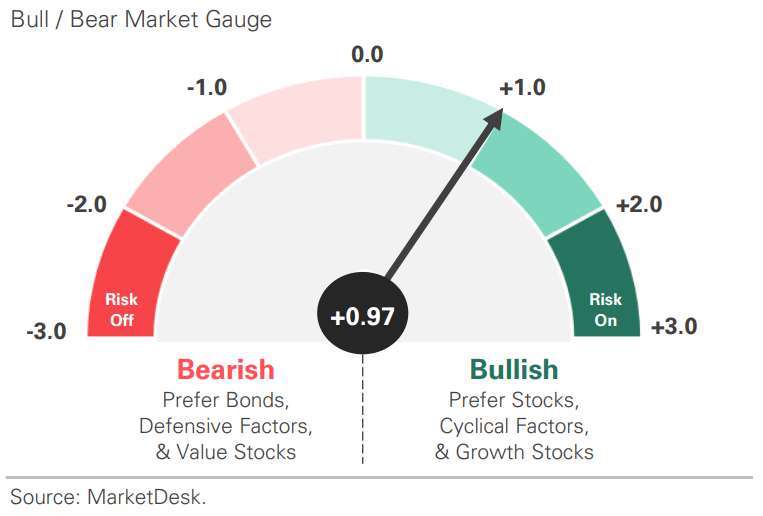
US Risk Demand Market Indicator
The US Risk Demand Indicator (USRDI) is a quantitative tool to measure real-time investor risk appetite. When the indicator is above zero, it signals a risk-on environment favoring cyclical sectors, high beta stocks, high-yield corporate bonds, and hybrid (convertible) bonds. In contrast, a reading below zero signals a risk-off environment favoring defensive sectors, low-volatility stocks, and US Treasury bonds.
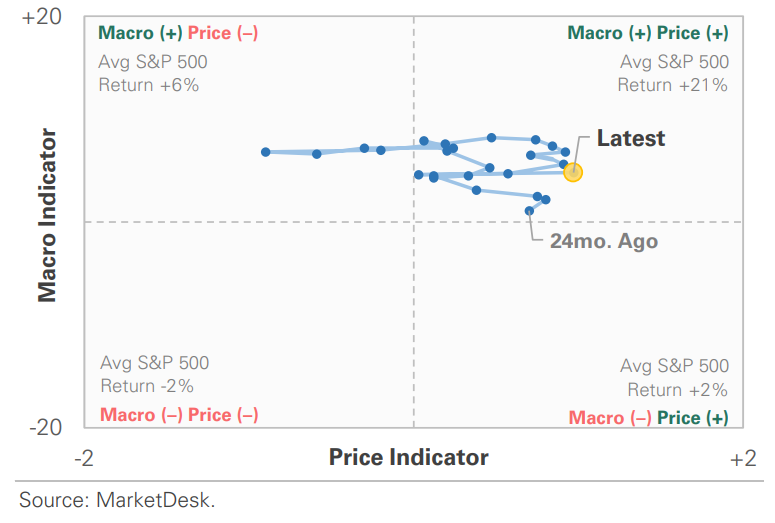
US Market Economic Cycle Indicator
The Market Cycle Indicator tracks two primary investor groups: macro investors and price-based investors. Macro investors rely on fundamental and economic data to guide their decisions, while price-based investors (or technical analysts) focus on price action, momentum, volume, and behavioral trends. The Indicator synthesizes these perspectives to identify the prevailing market regime.
S&P 500 Valuation Matrix
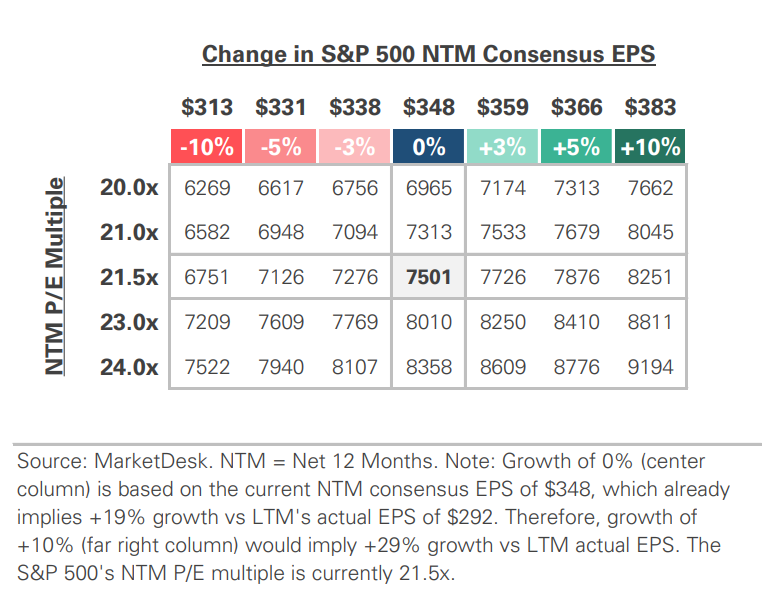
S&P 500 Forward PE Ratio
The S&P 500 forward price-to-earnings (P/E) ratio is a widely followed valuation metric that compares the index's current level to the projected earnings of its constituent companies over the next 12 months. The indicator implies to investors how much they are paying today for each dollar of expected future earnings.
Key Takeaways
#1 - Inflation
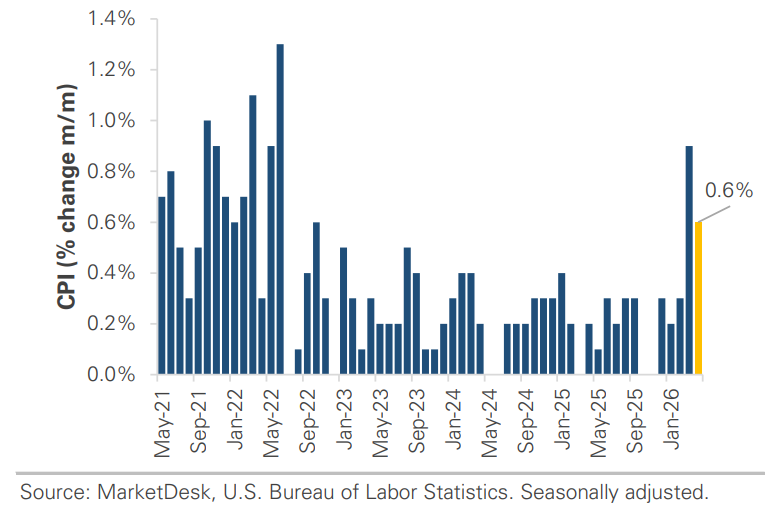
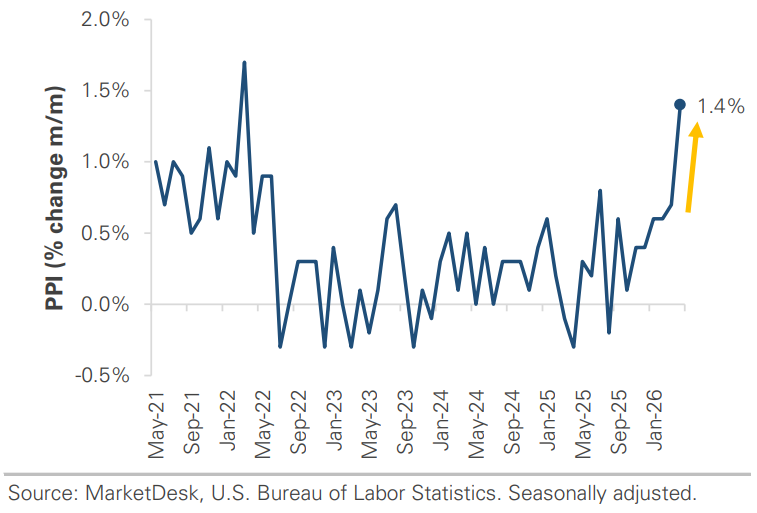
Inflation came in hot, with both consumer and producer prices surprisingly higher. Consumer prices rose +3.8% year-over-year in April, the highest in nearly three years. Wholesale prices delivered the bigger surprise, with a +6.0% y/y gain, the largest annual gain since December 2022. The two reports measure inflation at different points in the supply chain: wholesale captures what businesses pay, while consumer prices capture what households pay. A hot wholesale print signals the potential for more inflation pass-through. Higher gas prices drove a large share of the increases, but the rise was not limited to energy; service categories like airfare, hotels, and rent also rose.
Implication: The inflation that is building in energy markets is now showing up in the data, and the pressure is spreading beyond energy.
Consumer Prices Rise as Energy Costs Remain Elevated
Producer Prices Signal Inflationary Pressures
#2 - Oil Prices Rise
Oil prices rose this week as tensions between the U.S. and Iran reignited. Oil rose more than +5%, with most of the move coming on Monday after President Trump told reporters the Iranian ceasefire was “on life support.” Energy was the second-best performing sector of the week. Gasoline prices remain near $4.50 a gallon nationally, and the White House floated the idea of suspending the federal gas tax, an acknowledgment that pump prices have become a political concern.
Implication: The supply side of the inflation story remains unresolved. The longer oil stays elevated, the more the cost shows up in everyday spending categories like fuel, food, and transportation.
#3 - Interest Rates Rise
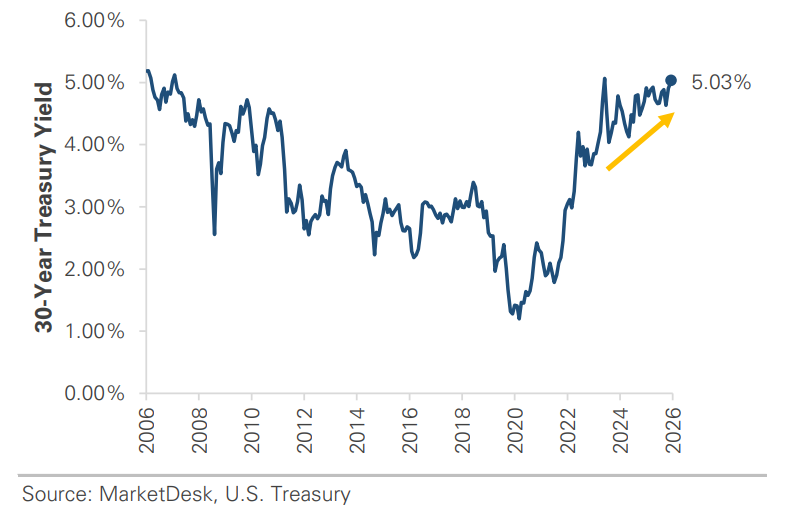
Interest rates rose as investors absorbed the inflation data. Treasury yields rose across the yield curve, including longer-term yields, which was notable. The move higher in long-term yields suggests the market expects inflation to remain elevated, with the 30-year yield rising above 5%. Short-term interest rates also rose, indicating that the market believes persistent inflation could pressure the Fed to raise rates. In related news, the Senate confirmed Kevin Warsh as the next Fed chair by the slimmest margin in modern history, with his first meeting in June.
Implication: Futures markets price in zero rate cuts for the rest of 2026, with consensus shifting toward interest rates staying higher for longer.
30-Year Treasury Yield Rises Above 5%
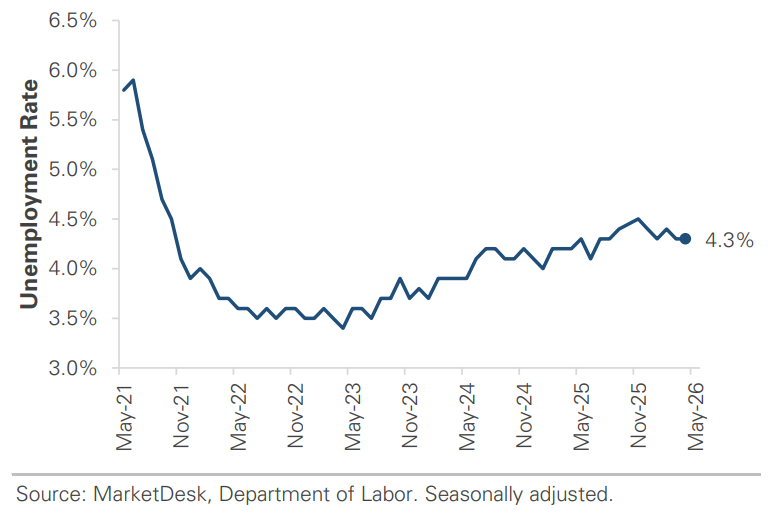
Unemployment Held Steady at 4.3% in April
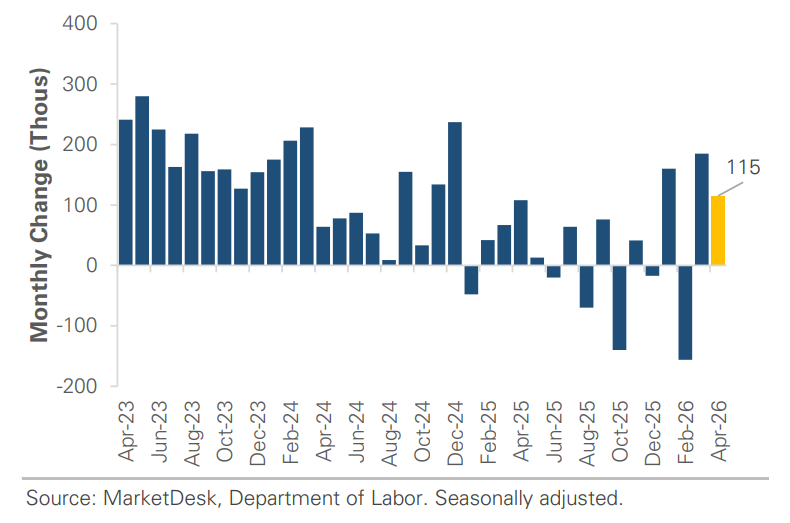
Monthly Job Growth Totaled +115,000
#4 -Major Indexes Set New Highs
Major stock indexes continued to set new highs despite a narrowing rally. The S&P 500 and Nasdaq both closed at new all-time highs, each up more than 2%. Most of the gain came on Wednesday at the start of a Trump-Xi summit in Beijing and strong moves in mega-cap tech stocks, with Apple crossing $300 a share for the first time. Beneath the index level, small-cap stocks and the equal-weight factor produced modest gains. Sector leadership rotated as well, with energy and defensive areas like healthcare and consumer staples rising while financials and industrials declined.
Implication: The major indexes continue to set new highs, but the broader market paused this week. The divergence does not necessarily break the rally’s longer-term trend, but it is worth watching as the inflation and interest-rate situation develops.
#5 - Retail Sales Increase
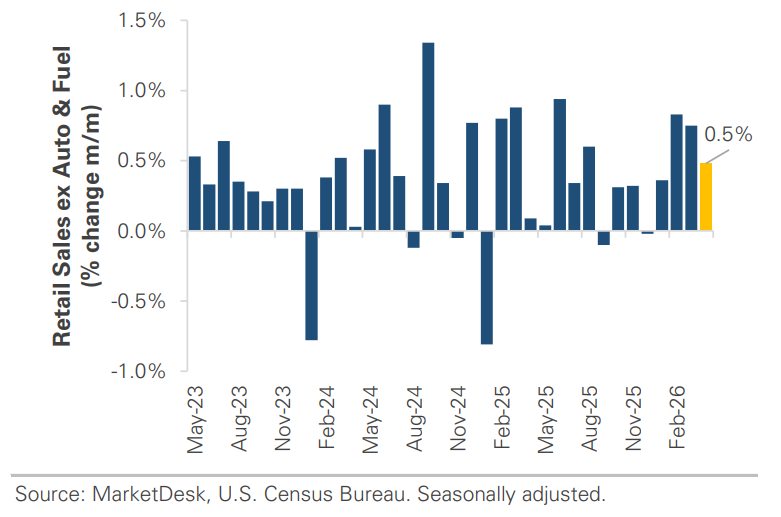
Consumers continue to spend despite rising gas prices. April retail sales beat expectations, growing +4.9% year-over-year. Excluding autos and fuel, the categories most affected by inflation saw spending rise +0.5% month-over-month.
Implication: April’s retail sales data is encouraging because it suggests consumer spending continues to hold up despite rising energy costs. The consumer’s strength is one of the key trends to monitor through the rest of the year. If spending slows due to higher prices, it could lead to slower economic growth.
Consumers Continue to Spend Despite High Oil Prices
Important Disclosures
This material is provided for general and educational purposes only and is not investment advice. Your investments should correspond to your financial needs, goals, and risk tolerance. Please consult an investment professional before making any investment or financial decisions or purchasing any financial, securities, or investment-related service or product, including any investment product or service described in these materials.
Our Insights


