Middle East Update, Stocks Set New Highs, Fed Policy, and Look Ahead to Next Week

Photo Credit: Adolfo Félix, Unsplash
Weekly Market Recap for April 24th
This week, markets moved higher for a fourth consecutive week, with the S&P 500 and Nasdaq both closing at fresh all-time highs for the second week in a row. The rally’s pace slowed, however, and the gains were uneven beneath the surface. Small-cap stocks outperformed both major indexes, while international stocks traded lower amid a rebound in oil prices and a strengthening U.S. dollar. Value stocks modestly outperformed growth stocks, and despite the S&P 500’s new high, 5 of 11 sectors traded lower, with defensive sectors lagging the rally. Bonds ended the week with modest gains despite yields drifting higher, with Treasury and corporate bonds producing similar returns. Oil prices rose after two consecutive weeks of declines, and a measure of market volatility ticked up as investors responded to geopolitical developments.
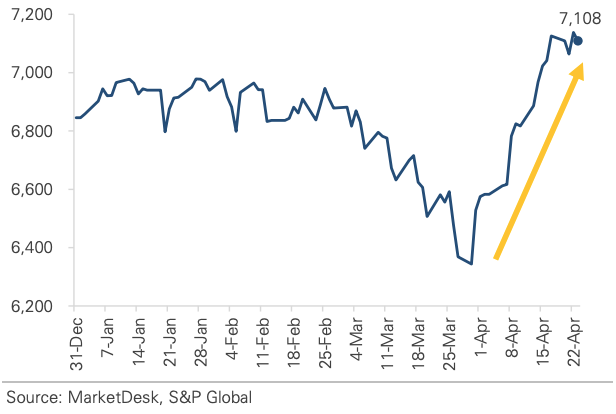
S&P 500 Index (Last 12 Months)
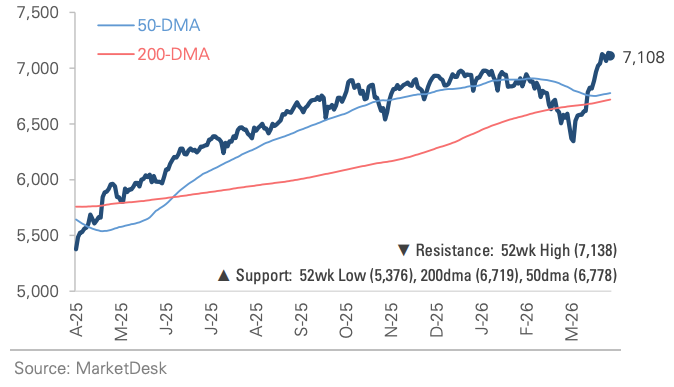
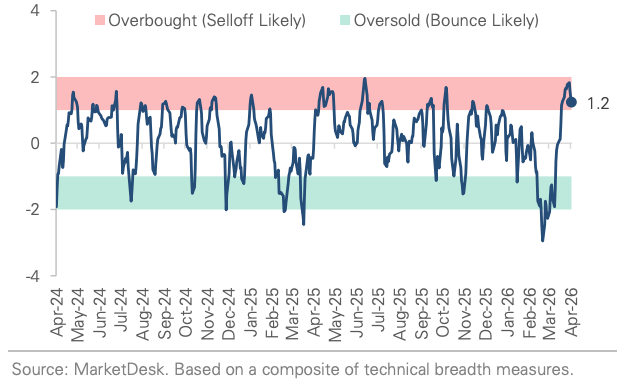
S&P 500 Technical Composite (Last 24 Months)
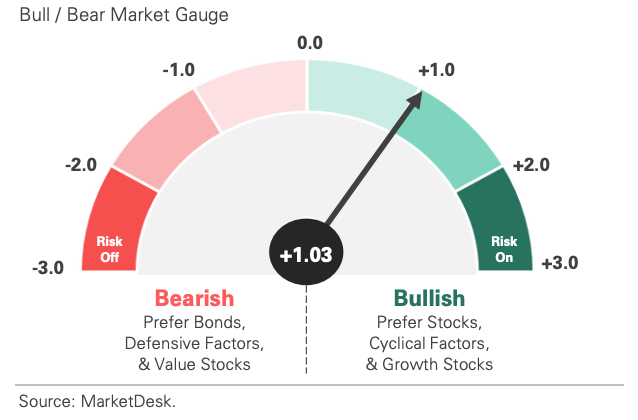
US Risk Demand Market Indicator
The US Risk Demand Indicator (USRDI) is a quantitative tool to measure real-time investor risk appetite. When the indicator is above zero, it signals a risk-on environment favoring cyclical sectors, high beta stocks, high-yield corporate bonds, and hybrid (convertible) bonds. In contrast, a reading below zero signals a risk-off environment favoring defensive sectors, low-volatility stocks, and US Treasury bonds.
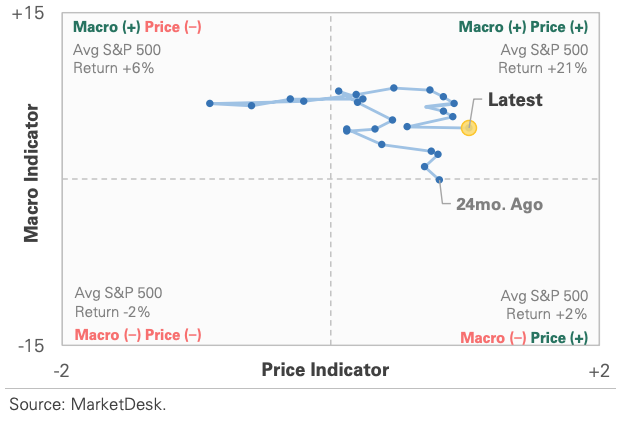
US Market Economic Cycle Indicator
The Market Cycle Indicator tracks two primary investor groups: macro investors and price-based investors. Macro investors rely on fundamental and economic data to guide their decisions, while price-based investors (or technical analysts) focus on price action, momentum, volume, and behavioral trends. The Indicator synthesizes these perspectives to identify the prevailing market regime.
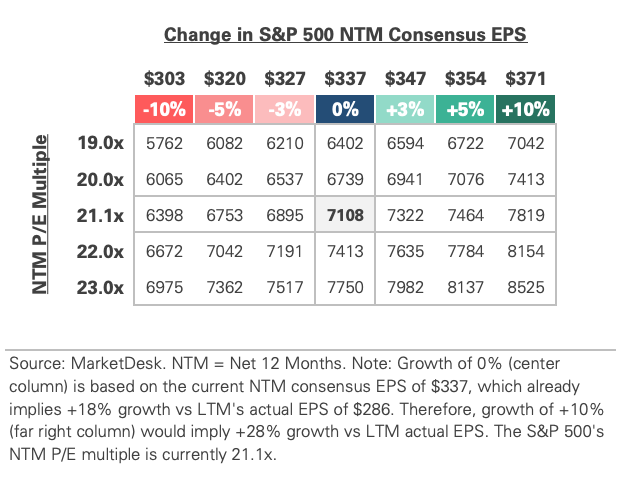
S&P 500 Valuation Matrix
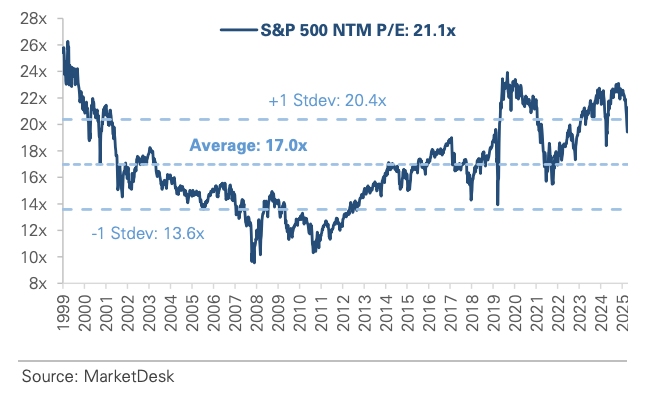
S&P 500 Forward PE Ratio
The S&P 500 forward price-to-earnings (P/E) ratio is a widely followed valuation metric that compares the index's current level to the projected earnings of its constituent companies over the next 12 months. The indicator implies to investors how much they are paying today for each dollar of expected future earnings.
Key Takeaways
#1 - U.S.-Iran Tensions
The week was defined by geopolitical whipsaw as U.S.-Iran tensions swung between diplomatic progress and physical deterioration. The headline was constructive: Trump extended the ceasefire indefinitely. However, the U.S. naval blockade of Iranian ports remained in place, scheduled peace talks were canceled, and questions emerged about a potential Iranian leadership change.
Implication: The diplomatic off-ramp is preserved, but it has not resolved the physical confrontation or removed the oil supply disruption.
#2 - Oil Prices Rise
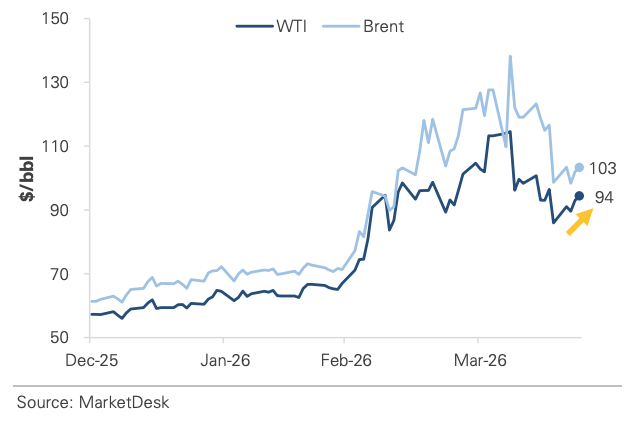
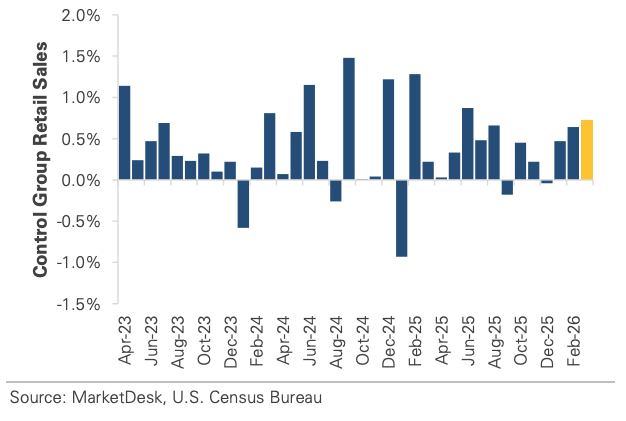
Oil prices rose as the naval blockade remained in place. Crude oil surged by more than 5% on the week, erasing some of the decline over the last two weeks, and Brent, the international benchmark, rose back above $100. The move was entirely geopolitical, with the ceasefire extension doing little to lower oil prices. This week’s retail sales report showed consumer spending held up in March despite rising energy costs, signaling strong consumer demand.
Implication: The two-week oil decline had been an encouraging sign that energy-driven inflation pressures might ease. That narrative was interrupted this week. The longer oil remains elevated, the greater the risk that energy costs begin to weigh on consumer spending, corporate profit margins, and economic activity. Oil prices are one of the most important variables to watch in the coming months.
WTI and Brent Crude Oil Rise
Consumer Spending Holds Up as Energy Costs Rise
#3 - Stocks Hit New Highs
Stocks hit new highs, but the rally’s pace slowed. The S&P 500 and Nasdaq both closed at fresh all-time highs midweek, driven by the ceasefire extension and a solid start to the Q1 earnings season. Nearly 25% of the SP 500 have reported Q1 2026 earnings, with ~80% beating estimates. The risk-premium compression that had occurred over the prior three weeks also stalled. The VIX rose modestly, and high-yield credit spreads were flat after three consecutive weeks of tightening, a sign that markets are digesting recent gains rather than pressing further into risk.
Implication: The rally remains intact, and the earnings backdrop is encouraging. However, the pause suggests the market may need a clearer geopolitical signal, such as a geopolitical resolution or positive diplomatic development, before moving higher.
SP 500 Continues to Set All-Time Highs
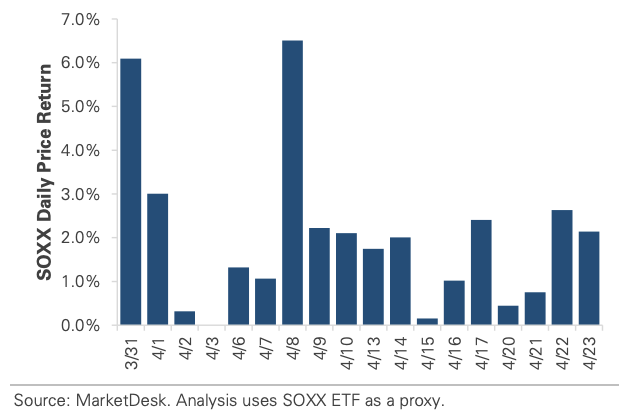
Semiconductor Stocks on Multi-Week Winning Streak
#4 -Treasury Yields Reverse Higher
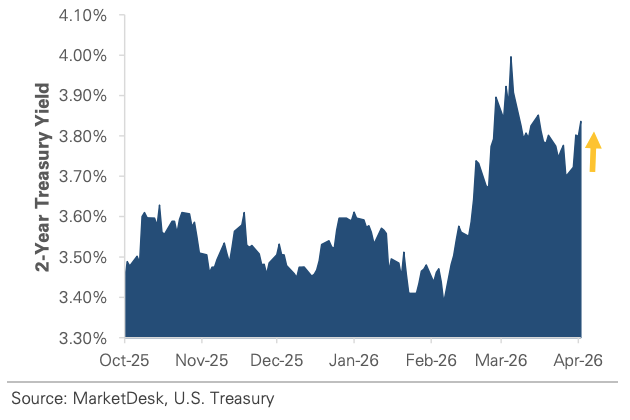
Treasury yield reversed higher as oil prices rose. The 2-year Treasury yield gave back nearly half of a three-week decline that had been building on ceasefire optimism and declining oil prices. The rise was driven by two factors: the collapse of the Iran peace talks and Fed Chair nominee Kevin Warsh’s Senate confirmation hearing, which added a Fed leadership transition risk premium to the geopolitical risk.
Implication: Last week’s interest rate picture suggested the Fed could cut rates if oil continued to fall. This week, the conviction around rate cuts softened, even for further-out dates. With oil reversing higher and Fed leadership in transition, the market is carrying both inflation-side risk and institutional uncertainty into next week’s Fed meeting.
Treasury Yields Reverse Higher
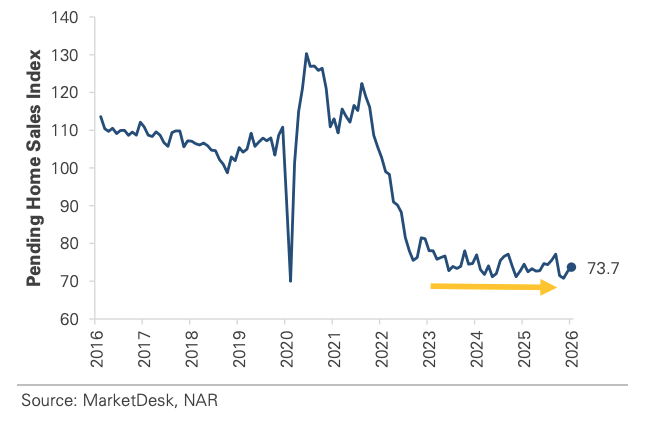
Pending Home Sales Improve, But Remain Sluggish
#5 - Next Week
Next week’s calendar is busy. The main event will be the Fed meeting, with Powell’s second-to-last press conference. The meeting takes place against a backdrop of rising oil prices, unresolved geopolitical tensions, and a Fed leadership transition. The policy decision is expected to be a hold, but Powell’s characterization of the inflation and growth backdrop will be closely watched. There is also a cluster of earnings reports from leading tech companies, including Microsoft, Alphabet, Meta, and Amazon, that will provide insight into the AI capital spending cycle.
Important Disclosures
This material is provided for general and educational purposes only and is not investment advice. Your investments should correspond to your financial needs, goals, and risk tolerance. Please consult an investment professional before making any investment or financial decisions or purchasing any financial, securities, or investment-related service or product, including any investment product or service described in these materials.
Our Insights