Stocks Set All-Time Highs While Growth Factor Outperforms

Weekly Market Recap for April 17th
This week, markets absorbed a failed ceasefire deal and a U.S. naval blockade of Iranian ports to close at a new all-time high. The S&P 500 gained nearly +3%, setting a new high as it extended an 11- session V-shaped recovery. The Nasdaq set a new high, gaining nearly 5%, as growth and tech stocks continued to trade higher, while the Russell 2000 and equal-weight S&P 500 traded higher but underperformed, as smaller companies lagged behind mega-cap stocks. Defensive sectors underperformed as stocks traded higher, with energy, industrial, and materials also declining. Bonds traded flat, with longer-maturity bonds modestly underperforming. Measures of stock market and interest rate volatility continued to decline as risk premiums faded, and oil prices finished the week lower despite surging higher early in the week.
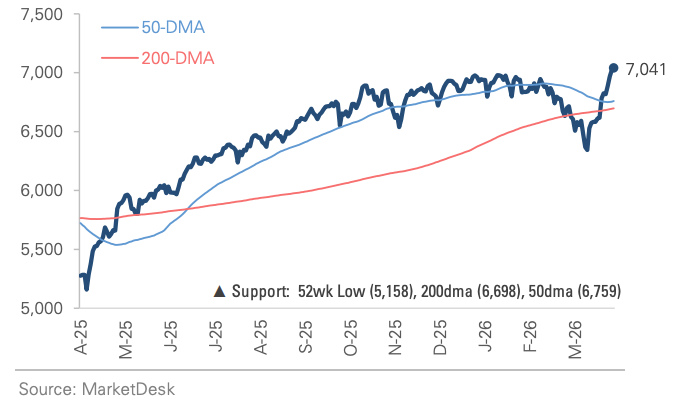
S&P 500 Index (Last 12 Months)
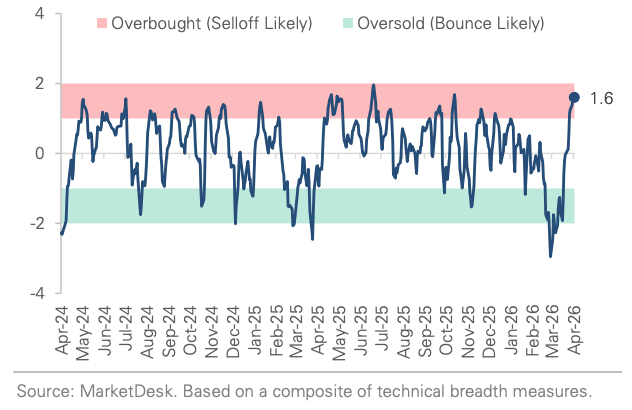
S&P 500 Technical Composite (Last 24 Months)
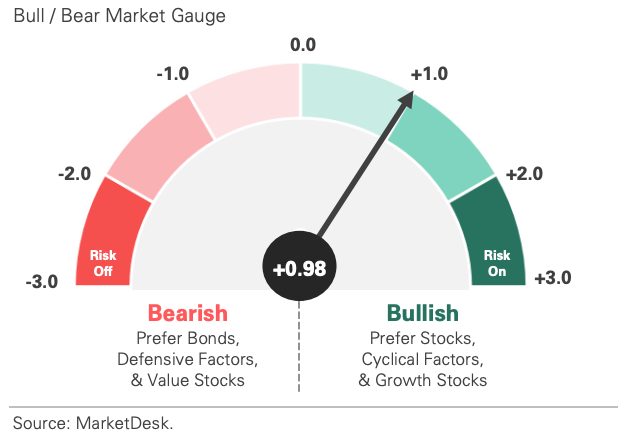
US Risk Demand Market Indicator
The US Risk Demand Indicator (USRDI) is a quantitative tool to measure real-time investor risk appetite. When the indicator is above zero, it signals a risk-on environment favoring cyclical sectors, high beta stocks, high-yield corporate bonds, and hybrid (convertible) bonds. In contrast, a reading below zero signals a risk-off environment favoring defensive sectors, low-volatility stocks, and US Treasury bonds.
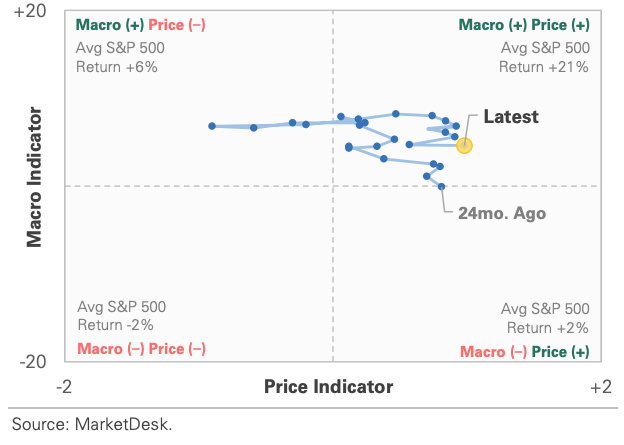
US Market Economic Cycle Indicator
The Market Cycle Indicator tracks two primary investor groups: macro investors and price-based investors. Macro investors rely on fundamental and economic data to guide their decisions, while price-based investors (or technical analysts) focus on price action, momentum, volume, and behavioral trends. The Indicator synthesizes these perspectives to identify the prevailing market regime.
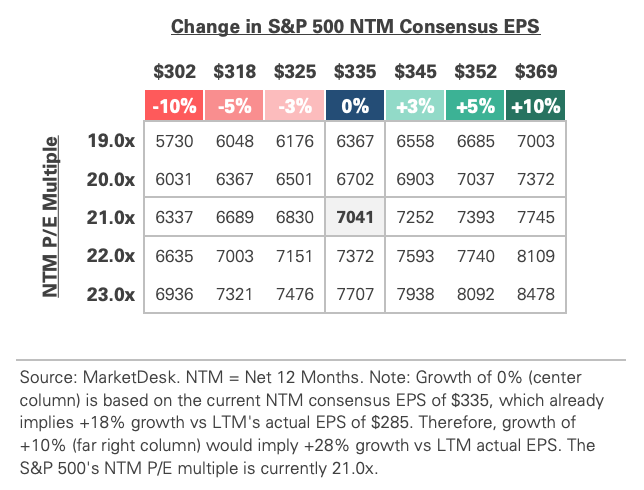
S&P 500 Valuation Matrix
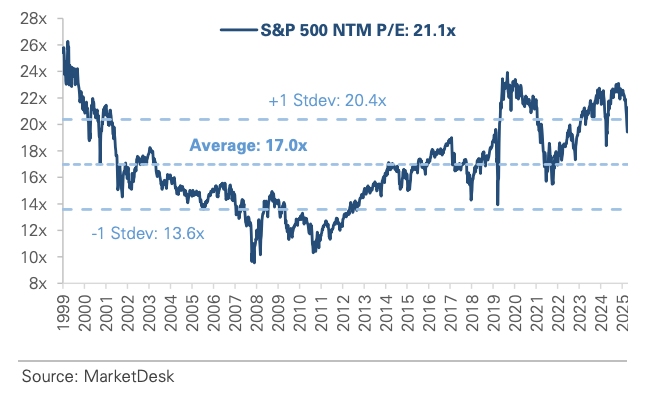
S&P 500 Forward PE Ratio
The S&P 500 forward price-to-earnings (P/E) ratio is a widely followed valuation metric that compares the index's current level to the projected earnings of its constituent companies over the next 12 months. The indicator implies to investors how much they are paying today for each dollar of expected future earnings.
Key Takeaways
#1 - SP 500 Sets New All-Time High
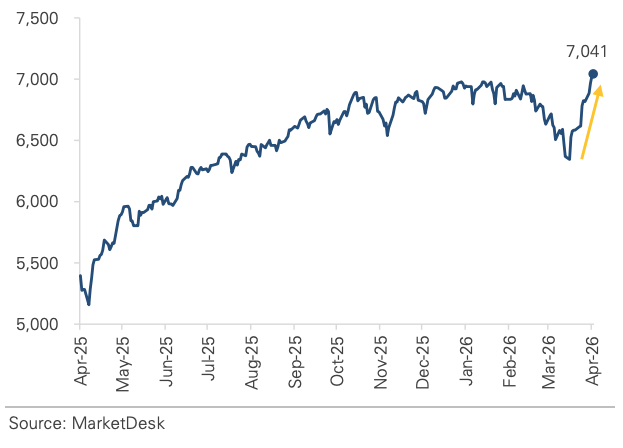
The S&P 500 set a new all-time high this week, trading above 7,000 for the first time since late January. The move completed an 11-session V-shaped recovery from the late-March market bottom, erasing a nearly 0% drawdown. The Nasdaq has logged 11 consecutive daily advances, its longest winning streak since 2020. Monday was the week’s test: overnight crude surged above $100 after the U.S. Navy blockade of Iranian ports took effect, sending stock futures lower. However, markets rose after confirmation that non-Iranian shipping would be unaffected.
Implication: The past 1.5 months offered a lesson in the cost of reactive positioning. Investors who held through the correction were rewarded as markets reclaimed their highs, a reminder that timing geopolitical events can be difficult and costly.
SP 500 Sets New High, Trades Back Above 7,000
#2 - Geopolitical Risk Premium Has Faded
Beyond the new stock market high, the geopolitical risk premium has faded as tensions ease. The VIX spiked above 30 at the height of the conflict in late March and has since fallen below 20, approaching pre-conflict levels. High-yield credit spreads tell a similar story, tightening steadily over recent weeks as geopolitical tensions eased. The improvement is broad-based across financial markets, with equity volatility, credit spreads, and rate volatility all moving in the same direction.
Implication: Multiple weeks of fading geopolitical risk premiums reinforce the market’s shift to risk-on sentiment. With the Strait still effectively closed and no official ceasefire in place, the market will be monitoring those risk metrics closely.
#3 - Growth and Technology Stocks Lead
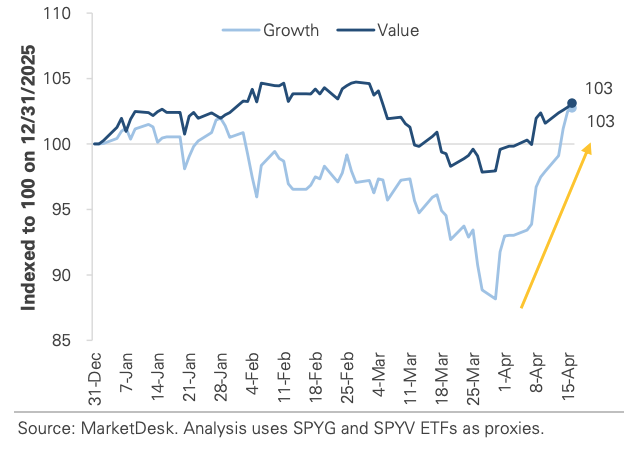
Growth and technology stocks have led the market’s recovery from its late-March low. Their outperformance closes the gap from earlier this year when Value and non-tech sectors led. For most of Q1, the broadening trade was the dominant narrative, with small caps, value, and international stocks outperforming mega-cap tech names that had driven the market’s gains in recent years. That dynamic reversed sharply off the market bottom, with Growth outperforming Value by over +11% in recent weeks. The YTD performance gap looks almost nothing like it did a month ago: Growth and Value have essentially converged.
Implication: This year has already cycled through two distinct factor environments: a broadening, Value-led regime to start the year, followed by a sharp Growth-led recovery off the market bottom. The back-and-forth underscores the value of maintaining diversified portfolio exposure across factors.
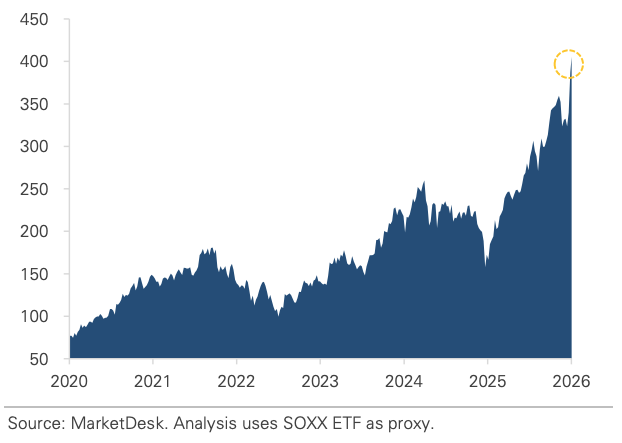
Growth Stocks Outperform After Slow Start to 2026
Semiconductor Stocks Set New All-Time High
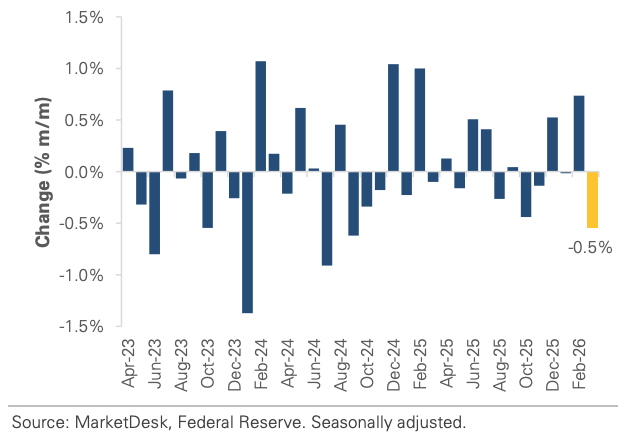
#4 - Industrial Production Contracts in March
Industrial production contracted in March after expanding in recent months. The decline coincided with oil price volatility and geopolitical uncertainty, a period when energy costs surged, and supply chain disruptions impacted manufacturing. The data paints a cautious picture of the real economy beneath the equity market’s record highs, but more recent data tells a different story. The April Philly Fed Manufacturing Index came in above expectations, suggesting activity has improved as tensions eased and energy prices fell.
Implication: The March weakness appears consistent with a war-driven disruption rather than a structural deterioration. The question is whether manufacturing will regain momentum in the coming months.
Industrial Production Contracted in March
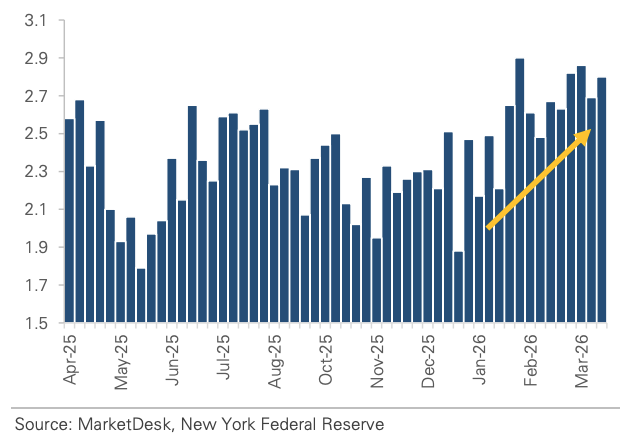
NY Fed’s Weekly Economic Index Continues to Rise
#5 - Wall Street Banks Report Strong Earnings
Major Wall Street banks reported strong Q1 earnings, driven by market volatility and record capital markets activity. Consumer credit quality remained healthy, and M&A revenue increased as deal activity picked up.
Implication: The group’s solid results were an encouraging start to earnings season, though several banks flagged the increasingly complex backdrop as a development to monitor.
Important Disclosures
This material is provided for general and educational purposes only and is not investment advice. Your investments should correspond to your financial needs, goals, and risk tolerance. Please consult an investment professional before making any investment or financial decisions or purchasing any financial, securities, or investment-related service or product, including any investment product or service described in these materials.
Our Insights