Delayed Jobs and Inflation Data, Fed Policy, and AI Stock Selloff

Photo Credit: Yuri Krupenin, Unsplash
Weekly Market Recap for December 19th
This week, the markets ended the week in a more measured and selective mood as investors digested signs of a cooling economy. Equity markets were choppy, with weakness concentrated in technology and AI-related stocks rather than across the broader market. The S&P 500 fell nearly -2%, while the Nasdaq and Russell 2000 declined close to -3%. The Growth, Momentum, and High Beta factors underperformed, while Value, Equal Weight, and Low Volatility outperformed on a relative basis. Technology and Energy both traded lower by over -4%, while Consumer Staples, Health Care, and Utilities traded higher. Bonds ended the week modestly higher as Treasury yields drifted lower, though longer-maturity bonds underperformed. The VIX market volatility index rose as technology stocks weighed on the broader index, and oil prices declined by nearly 3%.
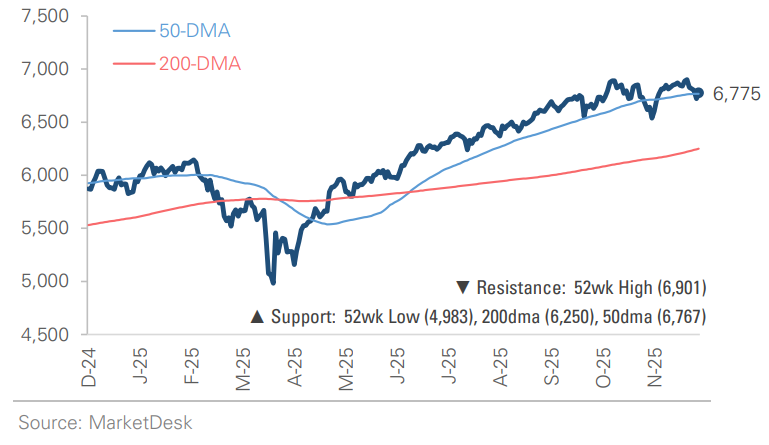
S&P 500 Index (Last 12 Months)
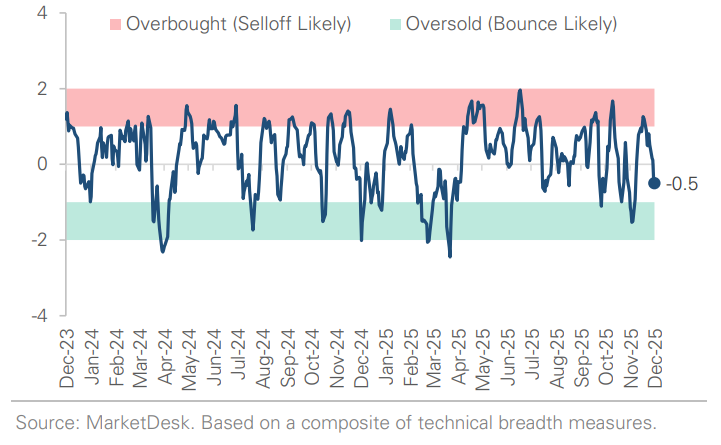
S&P 500 Technical Composite (Last 24 Months)
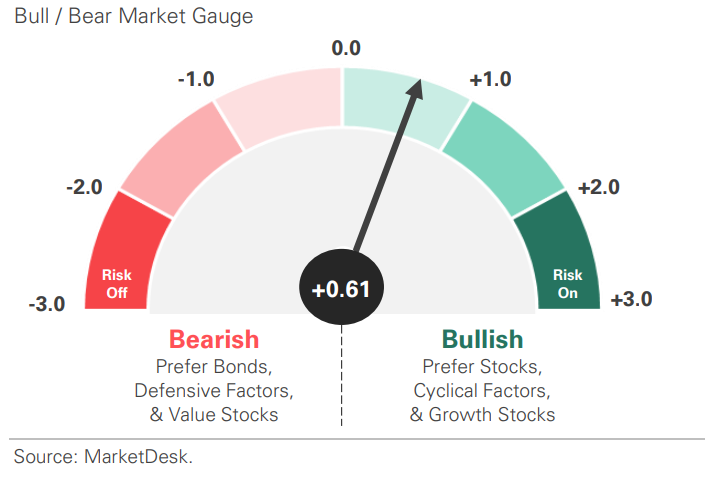
US Risk Demand Market Indicator
The US Risk Demand Indicator (USRDI) is a quantitative tool to measure real-time investor risk appetite. When the indicator is above zero, it signals a risk-on environment favoring cyclical sectors, high beta stocks, high-yield corporate bonds, and hybrid (convertible) bonds. In contrast, a reading below zero signals a risk-off environment favoring defensive sectors, low-volatility stocks, and US Treasury bonds.
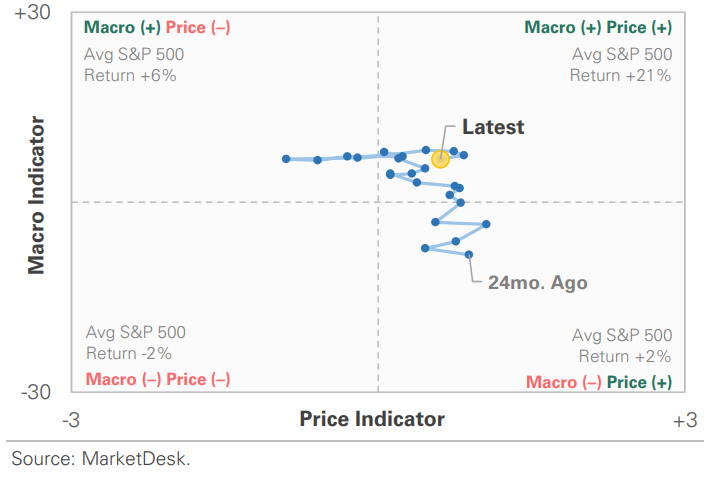
US Market Economic Cycle Indicator
The Market Cycle Indicator tracks two primary investor groups: macro investors and price-based investors. Macro investors rely on fundamental and economic data to guide their decisions, while price-based investors (or technical analysts) focus on price action, momentum, volume, and behavioral trends. The Indicator synthesizes these perspectives to identify the prevailing market regime.
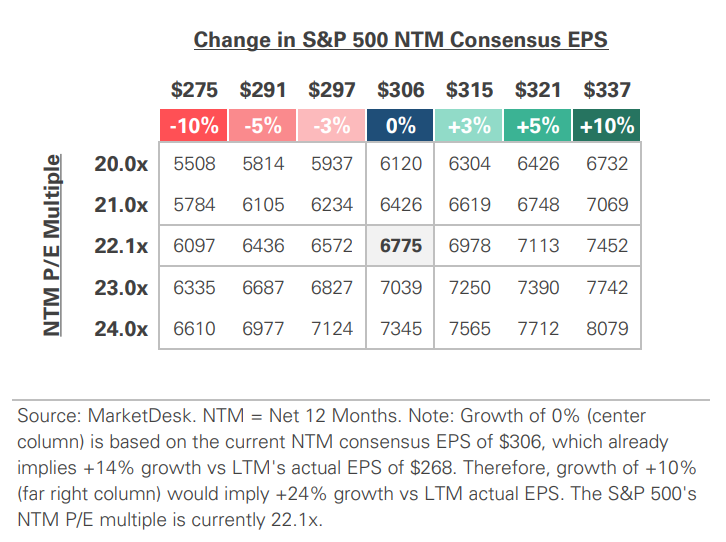
S&P 500 Valuation Matrix
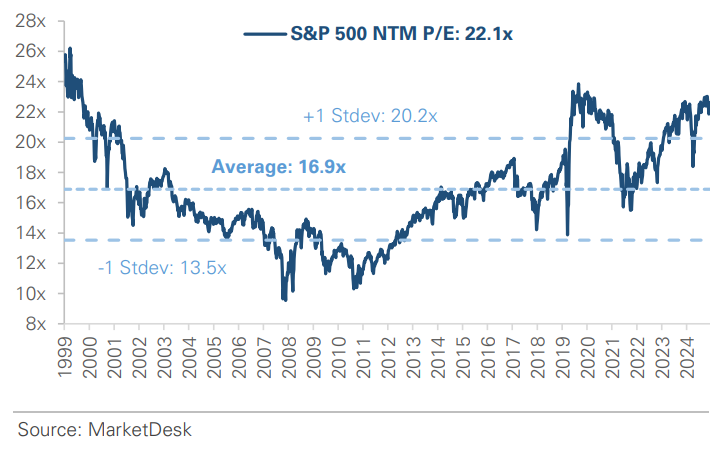
S&P 500 Forward PE Ratio
The S&P 500 forward price-to-earnings (P/E) ratio is a widely followed valuation metric that compares the index's current level to the projected earnings of its constituent companies over the next 12 months. The indicator implies to investors how much they are paying today for each dollar of expected future earnings.
Key Takeaways
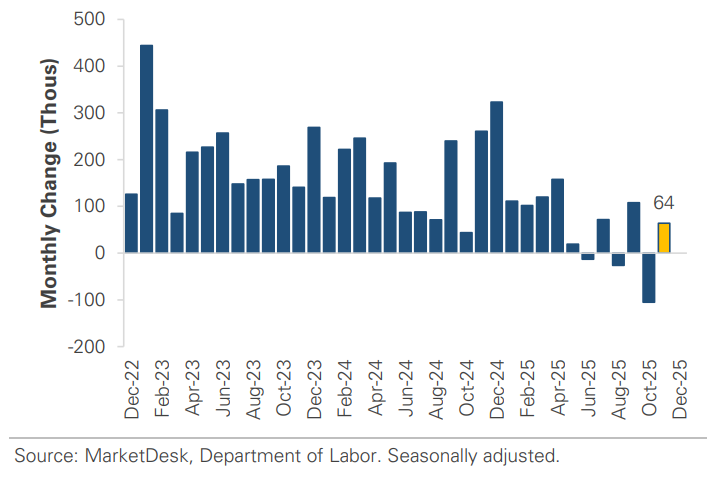
#1 - November Jobs Report
The November jobs report reinforced the view that hiring demand is gradually cooling rather than rolling over. Job growth has moderated, wage pressures continue to ease, and there remains little evidence of broad-based layoffs across the economy. While the labor market is no longer running hot, it remains resilient beneath the surface.
Implication: Cooling labor conditions support a soft landing, giving the Federal Reserve flexibility to delay rate changes and focus on incoming data.
Job Growth Rebounded in November
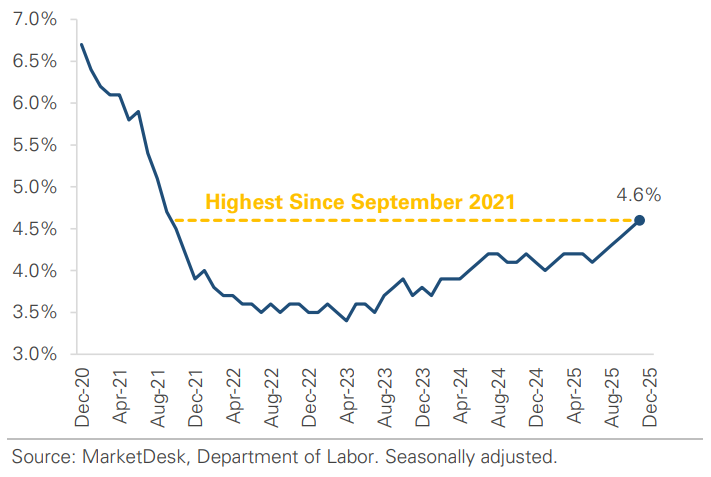
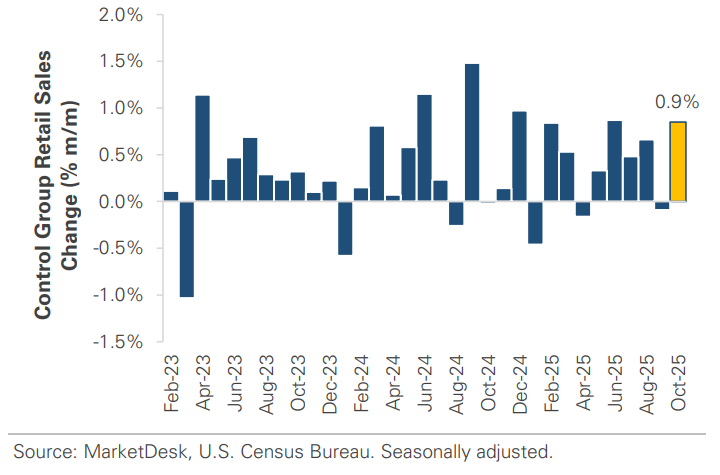
#2 - Cooling Growth
Recent economic data continued to point toward a gradual cooling in growth rather than an abrupt downturn. Regional manufacturing surveys and business activity softened, retail sales were flat, and housing sentiment remained subdued. Meanwhile, business inventories rose, and core consumer spending in categories outside autos and gasoline held up better, suggesting demand is cooling but not collapsing. The picture that emerges is one of deceleration, not contraction.
Implication: While the economy is no longer running as hot as earlier in the cycle, current conditions remain consistent with a soft landing rather than an imminent recession.
Unemployment Rose to a 4-Year High
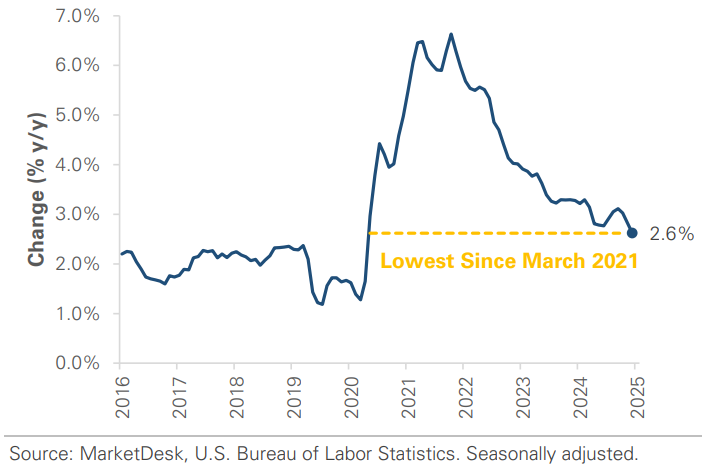
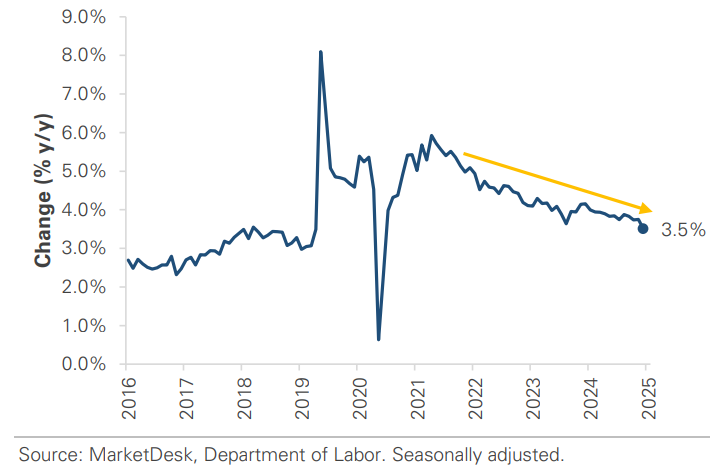
#3 - Inflation Data Shows Trend of Cooling Prices
Inflation data this week reinforced the trend of cooling price pressures across the economy. The delayed November CPI report came in below expectations, wage growth slowed, and oil prices are near a 4-year low. Together, the data reinforce the narrative of “disinflation plus slower growth". While inflation is not yet back to target, the direction of travel remains constructive.
Implication: The Fed stopped short of calling for a rate hike, but also did not endorse the market’s forecast for two cuts in 2026. Fed officials believe they're in the right neighborhood and now want to wait to see what happens.
Inflation Came in Below Expectations in October
Falling Wage Growth Signals Disinflation
Consumer Spending Remains Solid
#4 -Treasury Markets Adjust to Slower Growth
Treasury markets continued to adjust to a slower-growth, lower-inflation backdrop, with yields falling as investors balanced a cooling economy against a patient central bank. The market continues to price in more rate cuts than the Fed, despite this week’s jobs and inflation data justifying the Fed's patient approach.
Implication: The market and the Fed don't fully agree on the pace and timing of future cuts, but the gap is relatively small.
#5 - Major Indexes Finish Week Lower
Major U.S. equity indexes finished the week modestly lower, with the S&P 500 and Nasdaq showing significant volatility. Weakness was concentrated in mega-cap technology, growth, and AI-exposed stocks, which heavily impacted headline index performance. In contrast, the average stock was more resilient, with equal-weight indexes outperforming their cap-weighted counterparts.
Implication: This week’s declines in the index were driven by a narrow group of large-cap stocks rather than broad-based weakness.
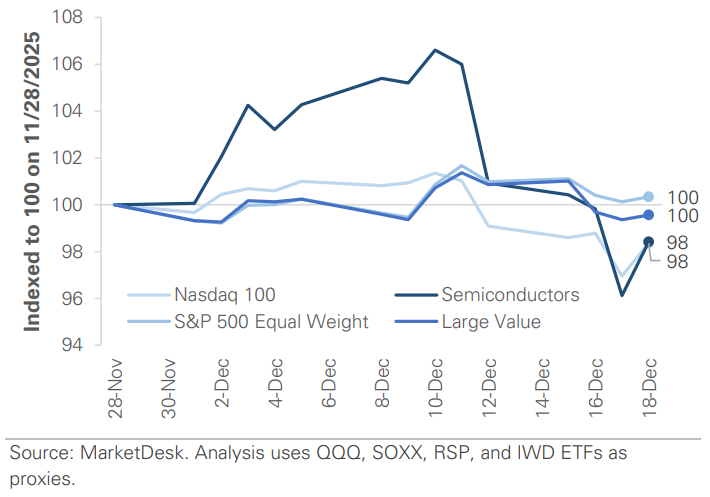
#6 - AI Stocks Remain Under Pressure
AI-related stocks remain under pressure, with chipmakers, cloud providers, and data-center-linked companies underperforming. The question is whether the pullback represents a healthy reset following strong gains or a sign of greater caution around capital spending and near-term profitability.
Implication: The selloff highlights the risks of concentration in a narrow set of high-expectation stocks. It does not negate the long-term potential of AI, but it underscores how quickly sentiment and valuations can adjust around crowded themes.
AI-Related Stocks Remain Under Presssure
Important Disclosures
This material is provided for general and educational purposes only and is not investment advice. Your investments should correspond to your financial needs, goals, and risk tolerance. Please consult an investment professional before making any investment or financial decisions or purchasing any financial, securities, or investment-related service or product, including any investment product or service described in these materials.
Our Insights


