Manufacturing Expansion, Mixed Labor Data, AI Debt Issuance, and AI Related Volatility

Photo Credit: Getty Images, Unsplash
Weekly Market Recap for February 13th
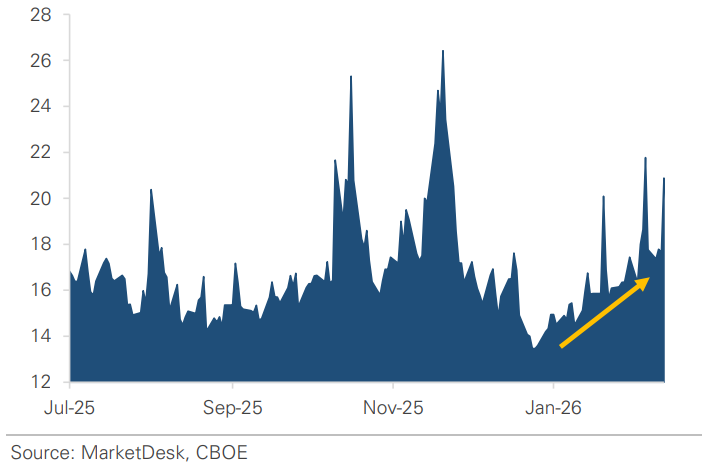
This week, stocks traded sideways before a late-week sell-off. The S&P 500 gained +0.5%, but it continued to lag the Russell 2000 and Equal Weight S&P 500. It's now underperforming both indices by over -5% YTD, while the Nasdaq and Large Cap Growth are down over -2% YTD as investors rotate and market leadership broadens. Sector performance was mixed, with both defensive and cyclical sectors outperforming the S&P 500. International stocks extended their leadership, with developed and emerging markets rising by more than 4% as the USD weakened. Treasury bonds traded higher as yields fell, with longer-maturity bonds outperforming shorter-maturity bonds. Investment-grade corporates outperformed high-yield due to their longer maturities. Gold and oil were modestly lower, and the VIX rose above 20 amid AI-related volatility.
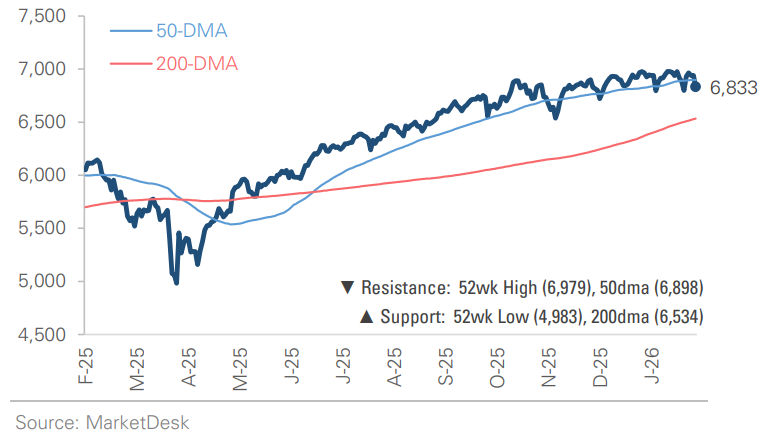
S&P 500 Index (Last 12 Months)
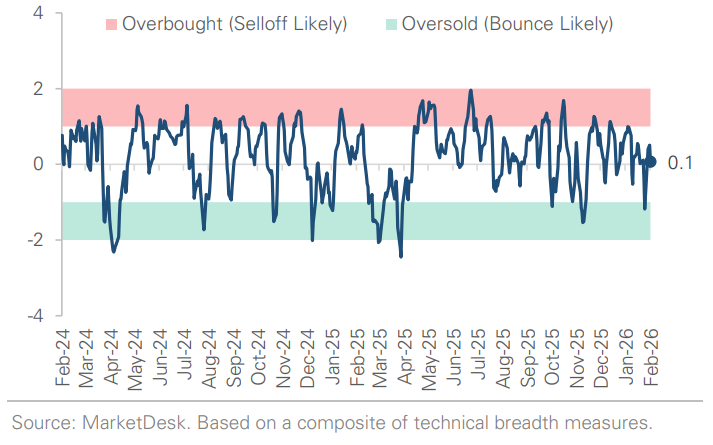
S&P 500 Technical Composite (Last 24 Months)
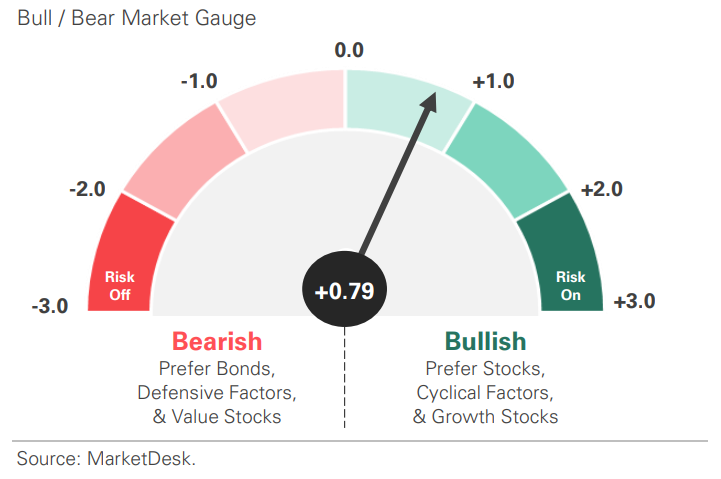
US Risk Demand Market Indicator
The US Risk Demand Indicator (USRDI) is a quantitative tool to measure real-time investor risk appetite. When the indicator is above zero, it signals a risk-on environment favoring cyclical sectors, high beta stocks, high-yield corporate bonds, and hybrid (convertible) bonds. In contrast, a reading below zero signals a risk-off environment favoring defensive sectors, low-volatility stocks, and US Treasury bonds.
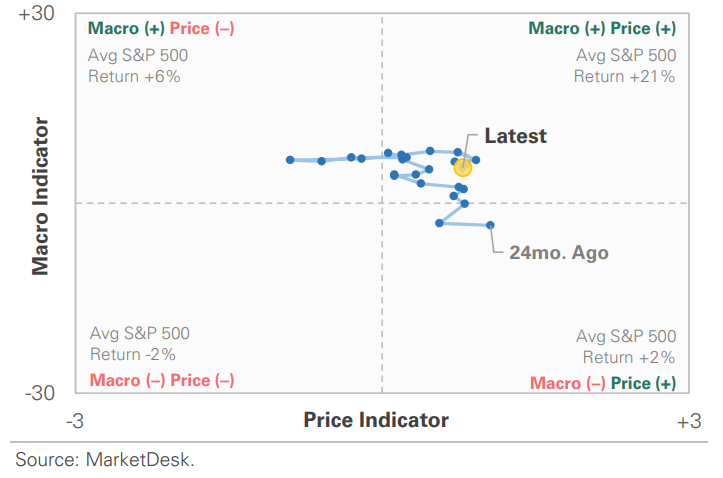
US Market Economic Cycle Indicator
The Market Cycle Indicator tracks two primary investor groups: macro investors and price-based investors. Macro investors rely on fundamental and economic data to guide their decisions, while price-based investors (or technical analysts) focus on price action, momentum, volume, and behavioral trends. The Indicator synthesizes these perspectives to identify the prevailing market regime.
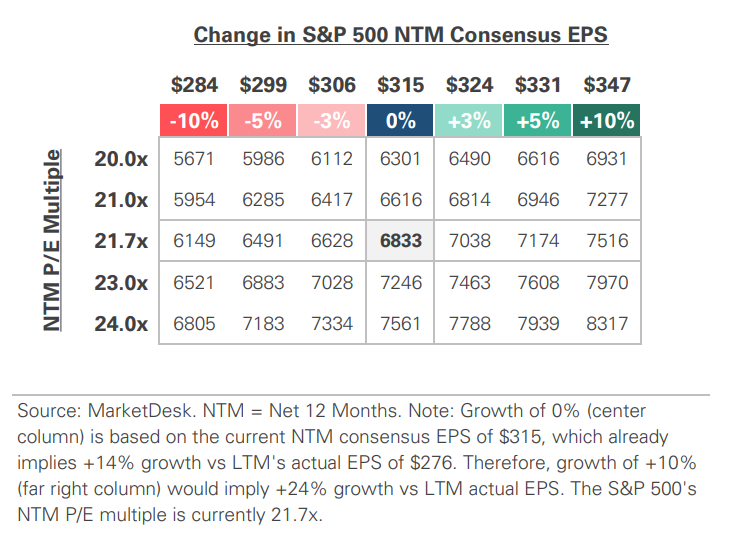
S&P 500 Valuation Matrix
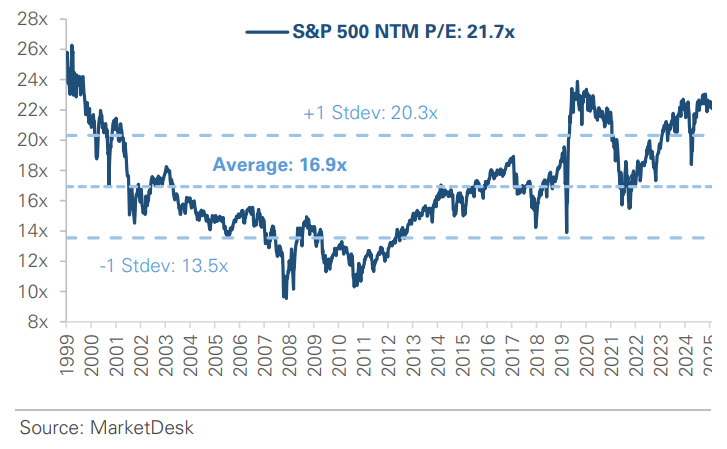
S&P 500 Forward PE Ratio
The S&P 500 forward price-to-earnings (P/E) ratio is a widely followed valuation metric that compares the index's current level to the projected earnings of its constituent companies over the next 12 months. The indicator implies to investors how much they are paying today for each dollar of expected future earnings.
Key Takeaways
#1 - Manufacturing Returns to Expansion
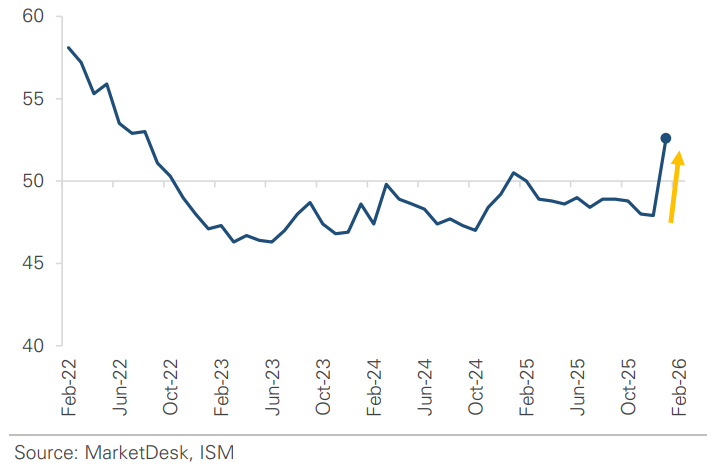
The ISM Manufacturing Index jumped to 52.6 from 47.9, crossing back into expansion territory for the first time in 10 months. The 4.7-point monthly increase was the strongest since 2022, and indexes tracking New Orders, Production, and Backlogs all improved, indicating demand is firm, and factories are struggling to keep pace. The strength was tied to increased capital spending as companies take advantage of restored 100% bonus depreciation incentives to upgrade equipment.
Implication: The inflection is a positive development, suggesting the industrial sector is stabilizing after a period of high interest rates and uncertain trade policy.
ISM Manufacturing PMI Returns to Expansion
#2 - Labor Market Data Sends Mixed Signals
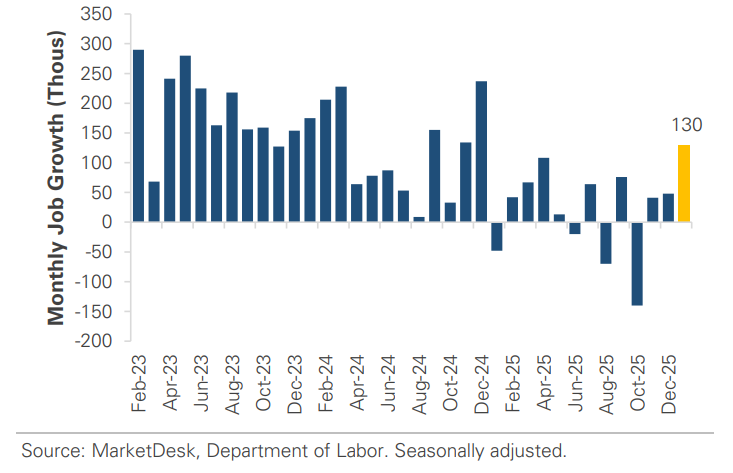
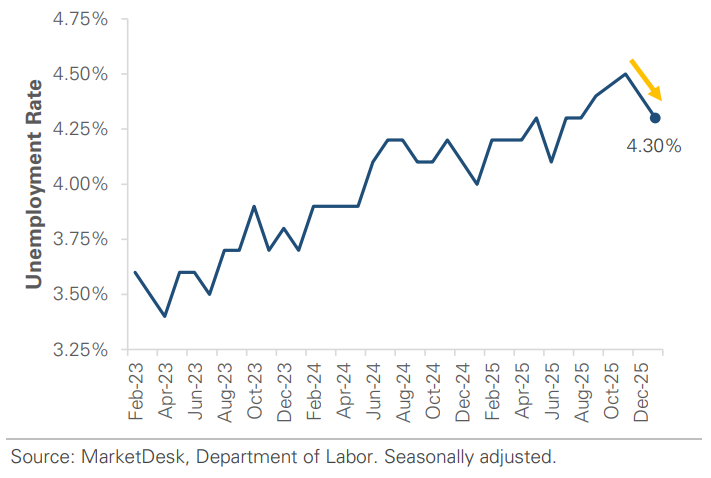
Job openings fell to 6.5 million in December, the lowest since September 2020 and 633,000 below consensus, signaling weakening labor demand. However, January’s payroll report surprised to the upside, with 130,000 jobs added versus expectations of 75,000. The unemployment rate fell from 4.4% to 4.3% despite rising labor force participation. The report also included major revisions that cut last year’s job growth to 181,000, the weakest since 2020 and far below the previously reported 584,000.
Implication: The labor market appears to be in transition: openings are shrinking, but employers are still filling existing roles, creating a low-hire, low-fire environment.
Monthly Job Growth Accelerates
US Unemployment Falls to 4.3%
#3 - Alphabet Raises $31 Billion in Debt to Fund AI Infrastructure
The offering helps finance its $185 billion capex forecast and drew strong demand, with orders exceeding $100 billion and the company tightening pricing. It included a rare 100-year bond, the first “Century Bond” from a tech company since the late 1990s. The deal follows Oracle’s $25 billion issuance last week and highlights how tech giants are turning to debt markets, with the sector projected to spend nearly $650 billion on AI infrastructure in 2026.
Implication: The AI infrastructure race is outpacing the sector’s cash flows. The buildout depends on continued access to capital, and this week’s strong demand suggests investors remain willing to fund the spending, for now.
#4 -AI Product Launches Trigger Volatility
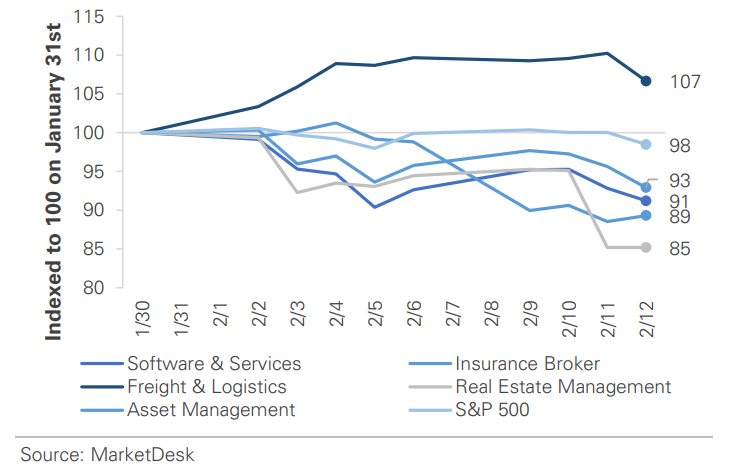
A wave of AI product launches has triggered sudden selloffs across multiple industries, including software, insurance, freight brokerage, and video game development, as investors worry about how AI tools and automation could alter business models. The pattern has become self-reinforcing: headlines trigger fear first, and fundamentals get revisited later. In many cases, market responses have been faster and more dramatic than the actual pace of real-world adoption.
Implication: The market is beginning to regard AI disruption as a real and immediate risk across a broader range of industries. The selloffs are a good example of how short-term sentiment can overwhelm long-term fundamentals.
AI Product Launches Spark Industry Selloffs
#5 - The Year-to-Date Rotation
Market leadership is shifting, as investors rotate away from mega-cap tech toward smaller companies, value stocks, and cyclical sectors. The S&P 500 is flat YTD, while the Russell 2000 and equal-weight S&P 500 have each gained more than +5%.
Implication: The rotation has been building over multiple months and is attributed to several of the above themes: a stabilizing economy, multiple Federal Reserve rate cuts in late 2025, and earnings growth spreading beyond big tech.
VIX Index Climbs Back Above 20
Important Disclosures
This material is provided for general and educational purposes only and is not investment advice. Your investments should correspond to your financial needs, goals, and risk tolerance. Please consult an investment professional before making any investment or financial decisions or purchasing any financial, securities, or investment-related service or product, including any investment product or service described in these materials.
Our Insights


