Fed Holds Rates Steady, AI Earnings Show Strong Demand, and Consumer Sentiment Remains Weak

Photo Credit: David Adamson, Unsplash
Weekly Market Recap for January 30th
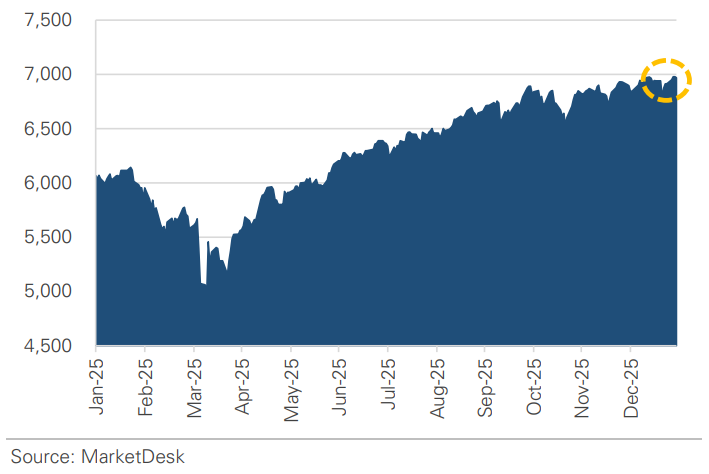
This week, markets were mixed as the rotation away from mega-cap stocks paused. The S&P 500 traded higher early in the week, briefly crossing the 7,000 level for the first time before a late-week pullback left it flat. The Nasdaq outperformed as technology stocks advanced, while the Russell 2000 declined amid stalled momentum in small-cap stocks. Growth stocks and the Momentum factor outperformed, while Value and the equal-weight S&P 500 lagged. Energy was the top-performing sector as oil rose to a 5-month high, while defensive sectors underperformed, led by Health Care. In the bond market, Treasury bonds posted modest gains as interest rates drifted lower, while corporate bonds traded lower amid widening credit spreads. A weaker US dollar boosted international stocks and commodity prices, with oil, gold, copper, and silver prices all surging.
S&P 500 Index (Last 12 Months)
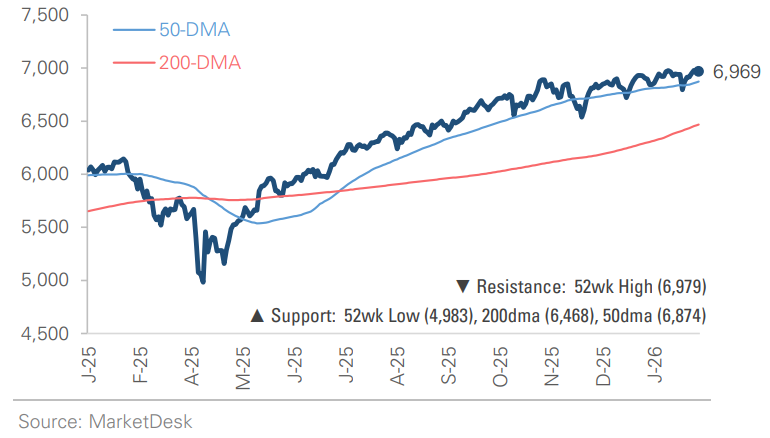
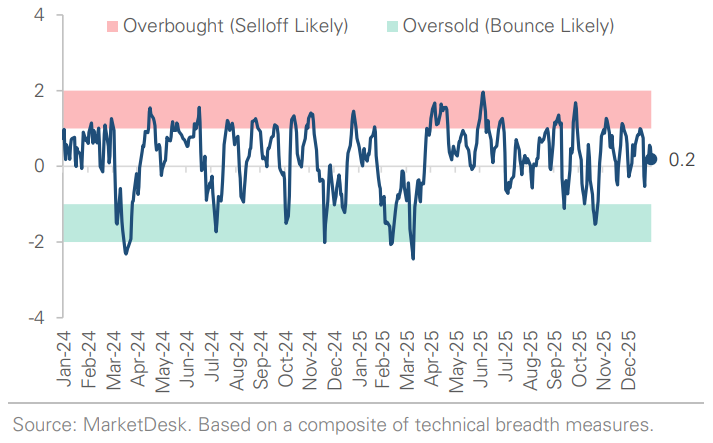
S&P 500 Technical Composite (Last 24 Months)
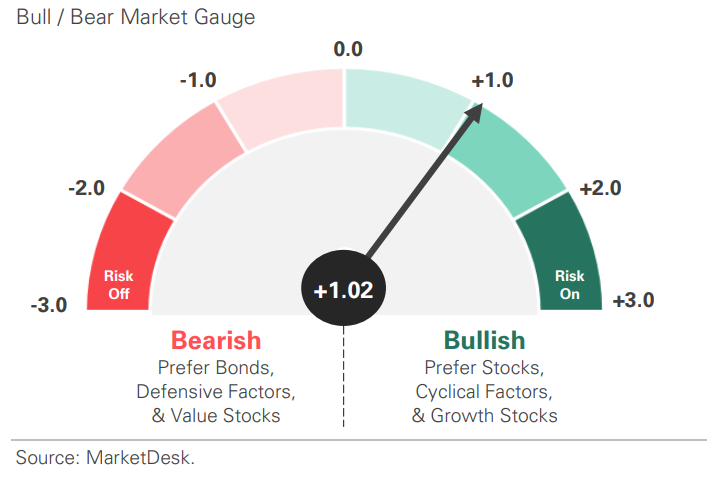
US Risk Demand Market Indicator
The US Risk Demand Indicator (USRDI) is a quantitative tool to measure real-time investor risk appetite. When the indicator is above zero, it signals a risk-on environment favoring cyclical sectors, high beta stocks, high-yield corporate bonds, and hybrid (convertible) bonds. In contrast, a reading below zero signals a risk-off environment favoring defensive sectors, low-volatility stocks, and US Treasury bonds.
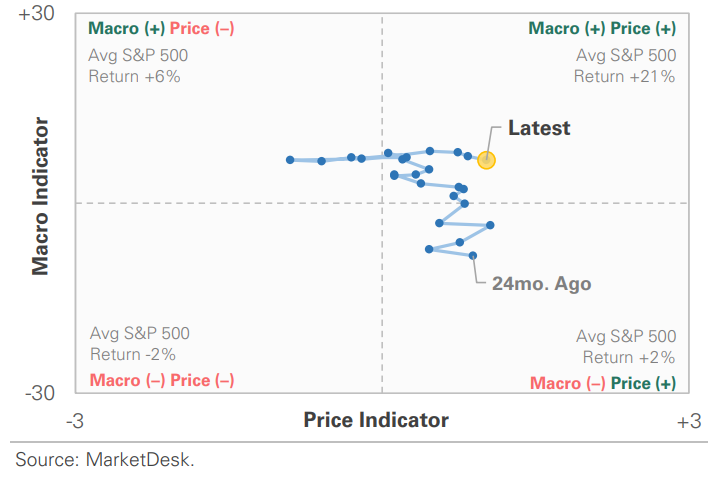
US Market Economic Cycle Indicator
The Market Cycle Indicator tracks two primary investor groups: macro investors and price-based investors. Macro investors rely on fundamental and economic data to guide their decisions, while price-based investors (or technical analysts) focus on price action, momentum, volume, and behavioral trends. The Indicator synthesizes these perspectives to identify the prevailing market regime.
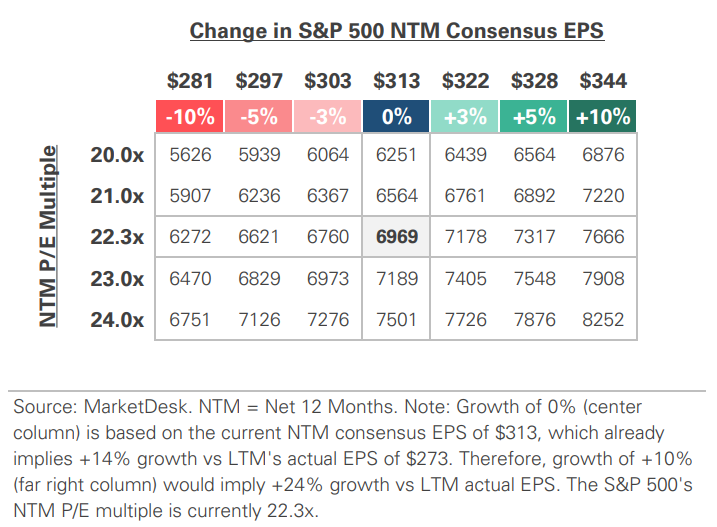
S&P 500 Valuation Matrix
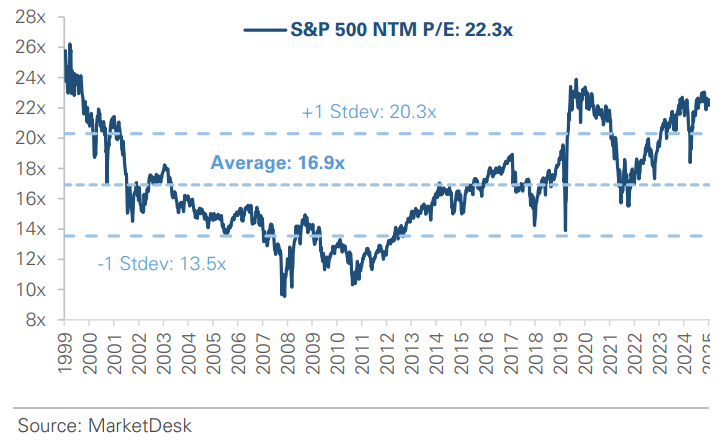
S&P 500 Forward PE Ratio
The S&P 500 forward price-to-earnings (P/E) ratio is a widely followed valuation metric that compares the index's current level to the projected earnings of its constituent companies over the next 12 months. The indicator implies to investors how much they are paying today for each dollar of expected future earnings.
Key Takeaways
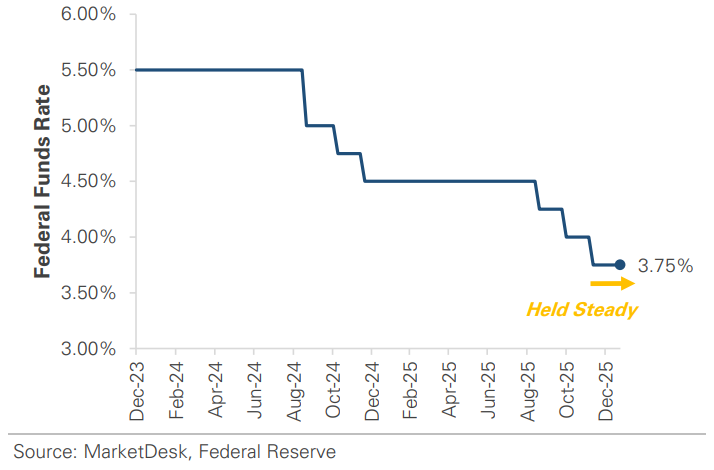
#1 - Fed Holds Interest Rates Steady
The Federal Reserve kept interest rates unchanged this week, holding the federal funds rate in a target range of 3.50% to 3.75%, a decision widely expected by markets. The decision wasn’t unanimous, with two officials favoring a cut, but the overall message signaled a wait-and-see approach as policymakers assess the impact of last year’s three rate cuts. The Federal Reserve’s policy statement adopted a slightly more optimistic tone, characterizing economic growth as solid and removing language that had previously highlighted risks to unemployment. The next cut is not expected until June.
Implication: The Fed’s decision and Chair Powell’s press conference reinforced that policymakers are in no hurry to cut rates further. Recent economic data have stabilized, and while inflation has eased from its pandemic highs, it remains above the Federal Reserve’s 2% target.
Federal Reserve Holds Rates Steady
#2 - AI Leaders Deliver Strong Results
Microsoft and Meta reported better-than-expected earnings this week, but their stock price reactions highlight a growing divide in how investors view AI capital expenditures. Microsoft reported strong demand for AI across its cloud and software products, but the stock traded lower as investors focused on slowing cloud growth. While AI demand is real, the rapid rise in spending to build AI capacity is weighing on profit margins. Microsoft’s results contributed to a broader stock market sell-off on Thursday as investors questioned the potential return on investment. Meta’s results told a different story. The company’s AI investments are already improving ad targeting and engagement, driving strong revenue growth that justifies the rapid rise in costs. The stock traded higher due to a clearer link between its AI spending and current profits.
Implication: Investors are shifting their focus from AI spending to visible monetization. Companies that can turn AI capex into revenue are favored over those still in the buildout phase.
S&P 500 Tops 7,000 for the First Time
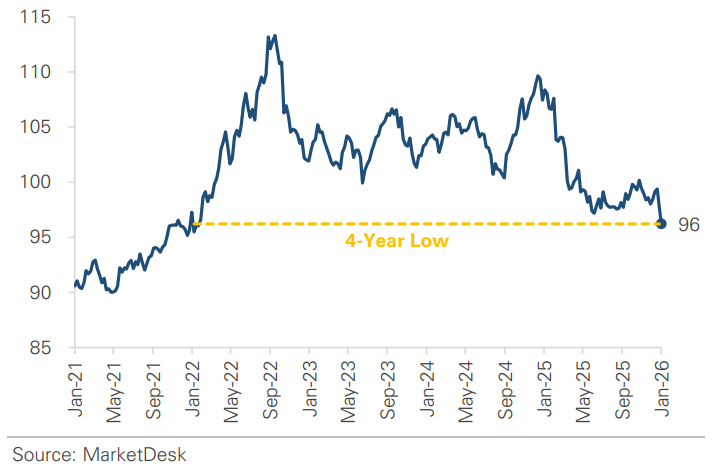
US Dollar Weakens to a 4-Year Low
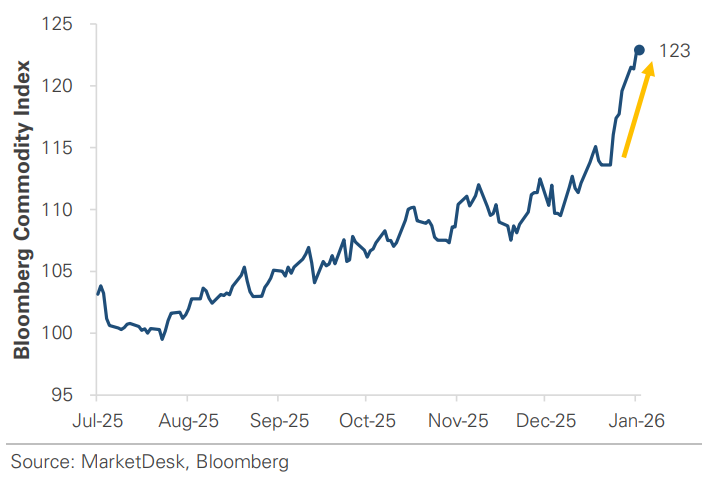
Commodity Prices Continue to Rise
#3 - Consumer Sentiment Remains Weak
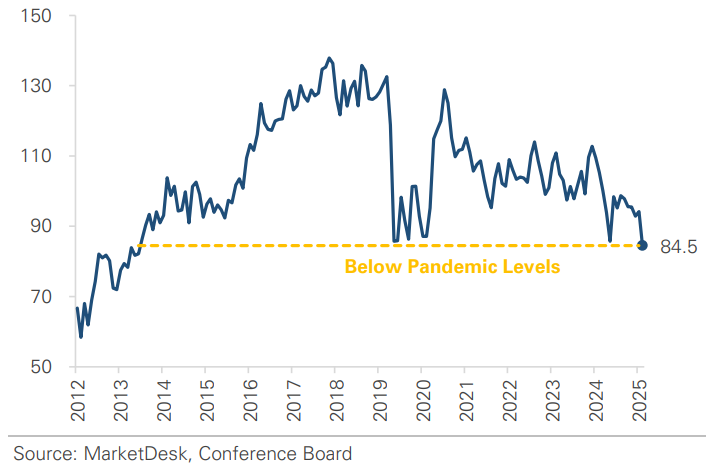
Consumer confidence fell sharply in January, raising concerns about household spending, a key driver of the U.S. economy. The Conference Board’s Consumer Confidence Index fell to 84.5, the lowest since 2014. The decline was broad-based, with all parts of the survey weakening as consumers became more concerned about both current conditions and the months ahead. The Expectations Index, which tracks the outlook for income and jobs, fell to 65.1. Survey responses indicate concerns about a soft labor market, rising prices for essentials such as food and energy, and uncertainty about tariffs and trade policy.
Implication: Consumer spending has remained strong in recent years, but the sharp drop in confidence increases the risk that households may pull back, potentially slowing the broader economy.
Consumer Confidence Falls Below Pandemic Levels
#4 -Home Prices Stabilize
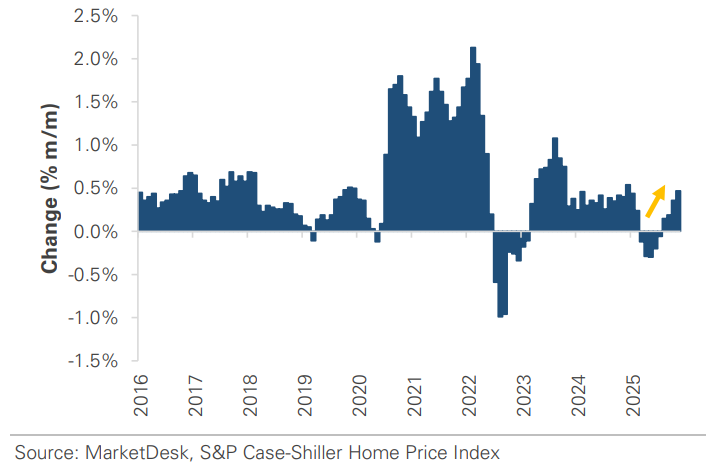
Home prices rose for a fourth consecutive month after falling for five straight months in mid-2025. The rise is being attributed to a continued supply-demand imbalance. Higher mortgage rates have kept many buyers on the sidelines, while many homeowners are locked into low mortgage rates and choosing not to sell. This limits the supply of homes for sale and supports prices.
Implication: Higher rates are weighing on buyer activity, but tight inventory is acting as a buffer against falling prices.
Home Prices Stabilize as Inventory Remains Tight
Important Disclosures
This material is provided for general and educational purposes only and is not investment advice. Your investments should correspond to your financial needs, goals, and risk tolerance. Please consult an investment professional before making any investment or financial decisions or purchasing any financial, securities, or investment-related service or product, including any investment product or service described in these materials.
Our Insights


