Tariff Headlines Create Volatility and Next Week's Fed Meeting

Photo Credit: Damian Markutt, Unsplash
Weekly Market Recap for January 23rd
This week, markets were choppy this week as policy headlines drove shifts in risk sentiment. Tariff-related developments sparked early-week volatility, though conditions stabilized as concerns eased. Major equity indexes like the S&P 500 and Nasdaq finished the week little changed, but leadership continued to rotate beneath the surface. Small-cap, value, and equal-weight indexes outperformed, while technology stocks and the growth factor weighed on market-cap-weighted benchmarks. In fixed income, Treasury yields rose across the curve, driving bond prices lower. Corporate credit spreads remained extremely tight by historical standards, and high yield continued to outperform investment-grade. Commodities were a strength, with gold rallying to new highs amid policy uncertainty.
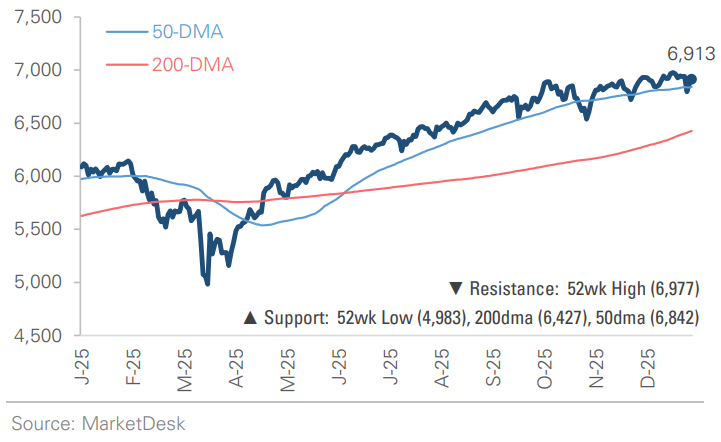
S&P 500 Index (Last 12 Months)
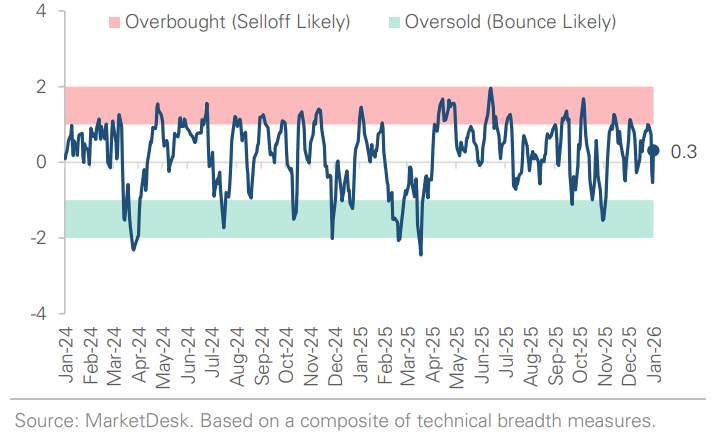
S&P 500 Technical Composite (Last 24 Months)
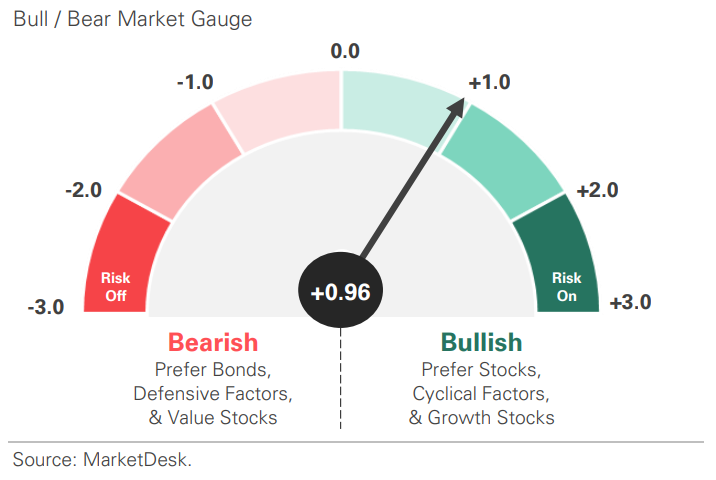
US Risk Demand Market Indicator
The US Risk Demand Indicator (USRDI) is a quantitative tool to measure real-time investor risk appetite. When the indicator is above zero, it signals a risk-on environment favoring cyclical sectors, high beta stocks, high-yield corporate bonds, and hybrid (convertible) bonds. In contrast, a reading below zero signals a risk-off environment favoring defensive sectors, low-volatility stocks, and US Treasury bonds.
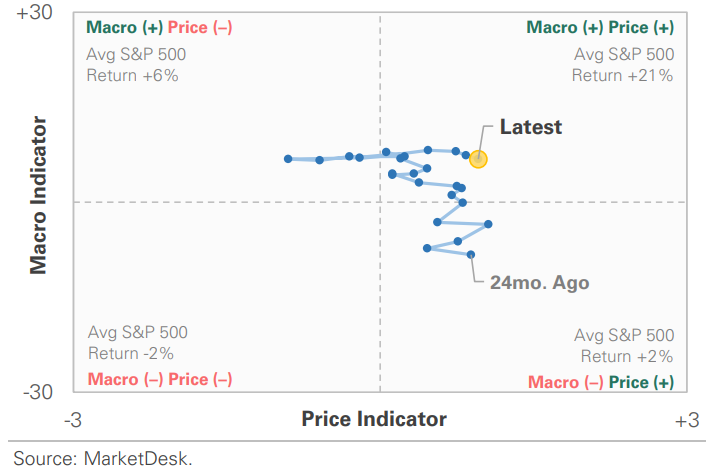
US Market Economic Cycle Indicator
The Market Cycle Indicator tracks two primary investor groups: macro investors and price-based investors. Macro investors rely on fundamental and economic data to guide their decisions, while price-based investors (or technical analysts) focus on price action, momentum, volume, and behavioral trends. The Indicator synthesizes these perspectives to identify the prevailing market regime.
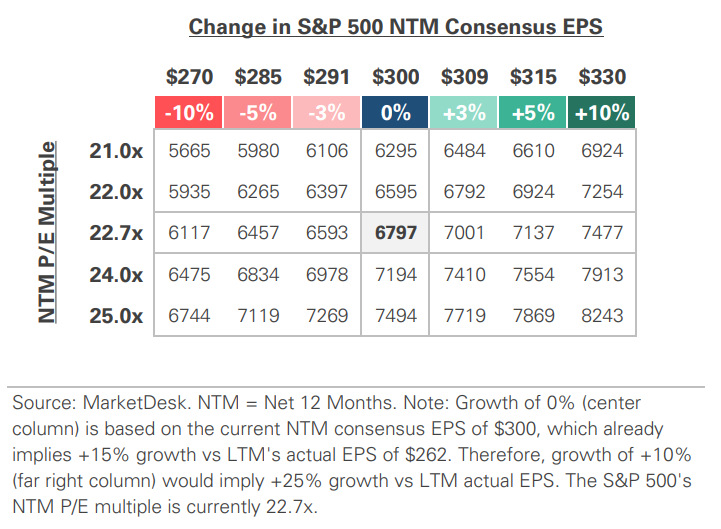
S&P 500 Valuation Matrix
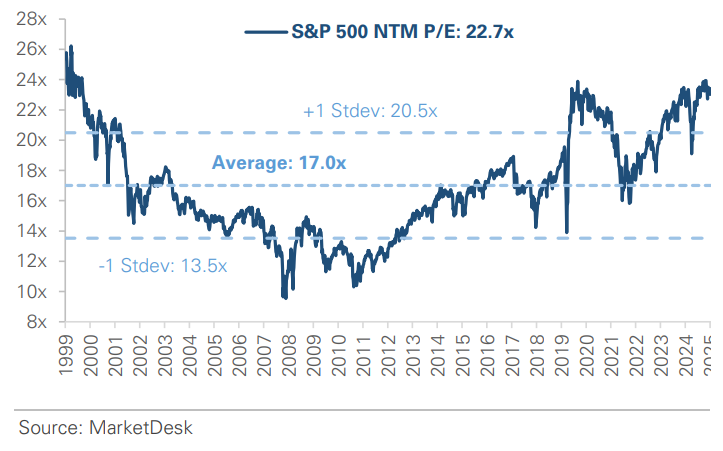
S&P 500 Forward PE Ratio
The S&P 500 forward price-to-earnings (P/E) ratio is a widely followed valuation metric that compares the index's current level to the projected earnings of its constituent companies over the next 12 months. The indicator implies to investors how much they are paying today for each dollar of expected future earnings.
Key Takeaways
#1 - Policy Headlines Trigger Brief Tariff Scare
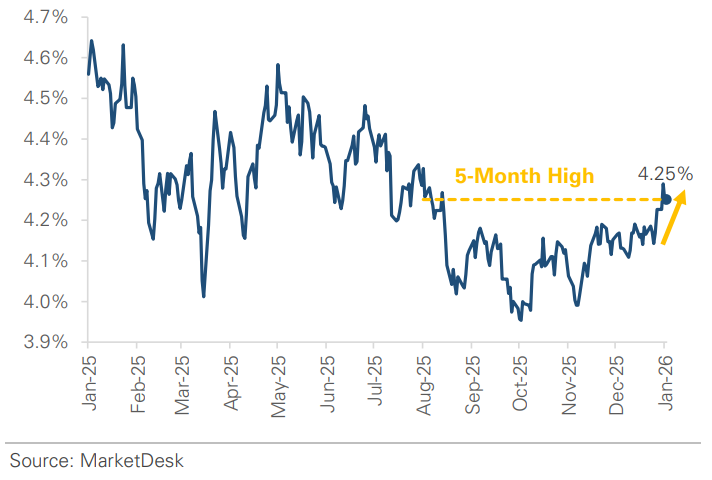
Markets were rattled this week after reports that the White House threatened new tariffs on European countries tied to negotiations involving Greenland. The headlines sparked a spike in volatility early in the week, with stocks and the U.S. dollar selling off as investors reacted to the prospect of renewed trade tensions. Treasury yields rose, with the 10-year yield hitting its highest level since August, while gold climbed to a new high as investors sought defensive positions. Volatility eased later in the week after officials walked back the tariff threat and signaled a potential deal framework, allowing stocks to rebound
Implication: The market's reaction was driven more by uncertainty than by a lasting economic impact, reinforcing that short-term news can generate market volatility without changing long-term fundamentals.
US 10-Year Treasury Rises to 5-Month High
#2 - Big Picture Trends Remain in Place
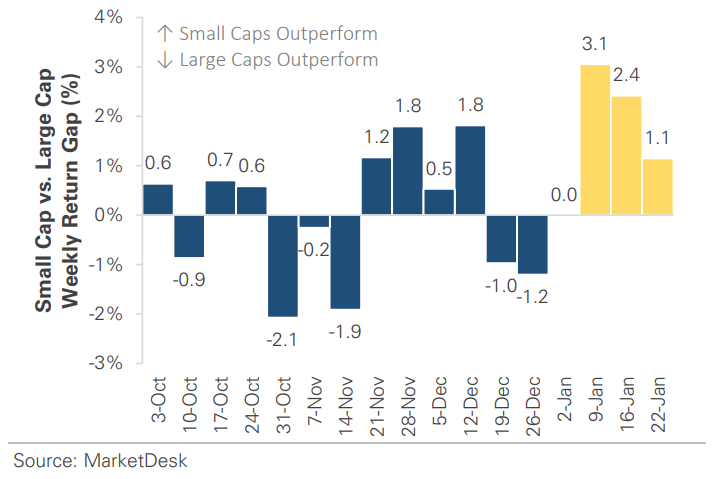
The market’s major trends remain intact despite headline-driven volatility. Leadership continued to broaden beyond mega-cap technology stocks, with small-cap and equal-weight indexes outperforming and signaling stronger participation beneath the surface even as headline indexes declined. While major indexes pulled back, the underlying rotation suggests investors are reallocating rather than exiting equities. In the bond market, Treasury yields rose across the yield curve, while corporate credit spreads remained tight. Meanwhile, gold continues to push to new highs, reinforcing its role as a hedge against policy uncertainty and market volatility.
Implication: The volatility did not disrupt underlying market trends. The continued strength of assets like gold, alongside shifting equity leadership, underscores the role diversification can play in helping portfolios navigate uncertainty and volatility.
Small Caps Outperform as Rotation Continues
#3 - Economic Conditions Largely Unchanged
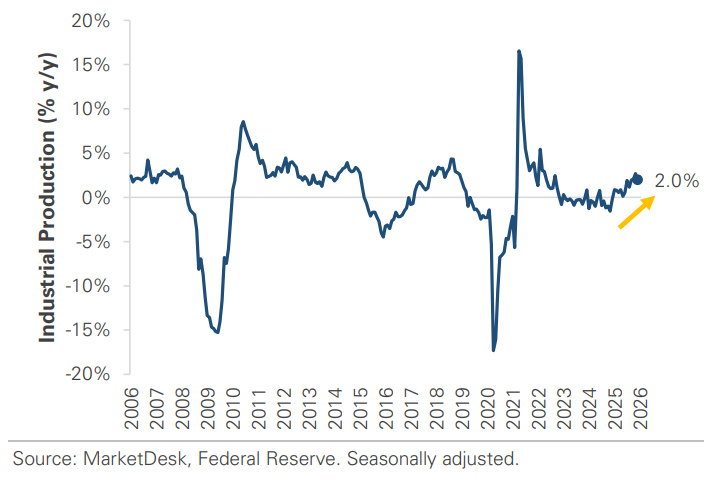
As the government shutdown data backlog continues to be cleared, the economic backdrop appears broadly unchanged. Labor market conditions continue to cool, industrial activity is soft, and housing demand is improving, while consumer spending has proven resilient.
Implication: This mixed but stable backdrop has not generated new inflation or growth signals that would require a policy shift. It allows the Federal Reserve to remain patient and monitor how these trends evolve before considering additional policy changes.
US Manufacturing Activity Continues to Improve
#4 -Fed Meeting Preview
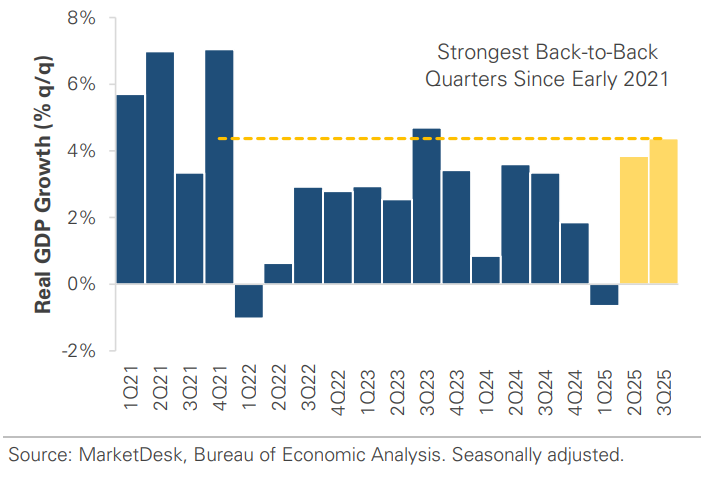
Markets head into next week’s Federal Reserve meeting expecting no change in policy. Investors expect the Fed to leave interest rates unchanged, as inflation continues to ease while economic growth and the labor market remain resilient. This combination gives policymakers little urgency to move quickly.
Implication: Markets will focus on how officials frame the progress of inflation and their thinking on the timing of potential rate cuts later this year.
US Q3 GDP Growth Stronger Than Initially Reported
#5 - Gold and Bitcoin Diverge
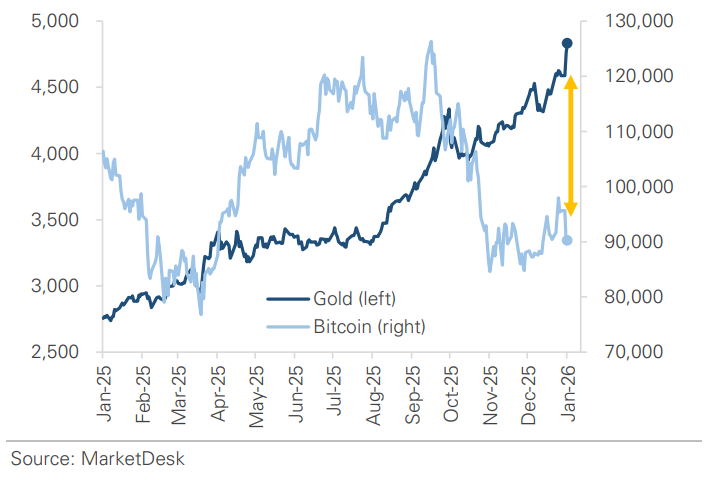
Gold and Bitcoin moved in opposite directions this week, underscoring how the two assets can behave differently even when grouped together. Gold rallied to new highs amid policy uncertainty and demand for defensive positioning, while Bitcoin gave back last week’s gains.
Implication: The divergence highlights that while both are viewed as alternative assets, they tend to respond to different market forces. Gold is more tied to defensive and hedging demand, while Bitcoin is more sensitive to shifts in risk appetite.
Bitcoin and Gold Continue to Diverge
Important Disclosures
This material is provided for general and educational purposes only and is not investment advice. Your investments should correspond to your financial needs, goals, and risk tolerance. Please consult an investment professional before making any investment or financial decisions or purchasing any financial, securities, or investment-related service or product, including any investment product or service described in these materials.
Our Insights