Soft Jobs Growth, Easing Inflation, Solid Consumer Spending, and Uncertain Fed Policy

Photo Credit: Mathias Jensen, Unsplash
Weekly Market Recap for January 16th
This week, the markets were mixed, with last week’s rotation carrying over. The S&P 500 and Nasdaq posted modest gains, while small-cap, value, and equal-weight benchmarks outperformed, highlighting the ongoing shift in market leadership. Treasury yields fluctuated throughout the week, responding to a combination of falling unemployment, easing inflation, and solid consumer spending. Shorter-maturity Treasury yields rose as expectations for a near-term rate cut diminished, while longer-maturity yields declined. Longer-maturity Treasury and corporate bonds outperformed, while corporate high-yield was flat. Commodities rallied, led by a sharp rise in oil and gains in gold and copper, and bitcoin rose to the highest level since mid-November.
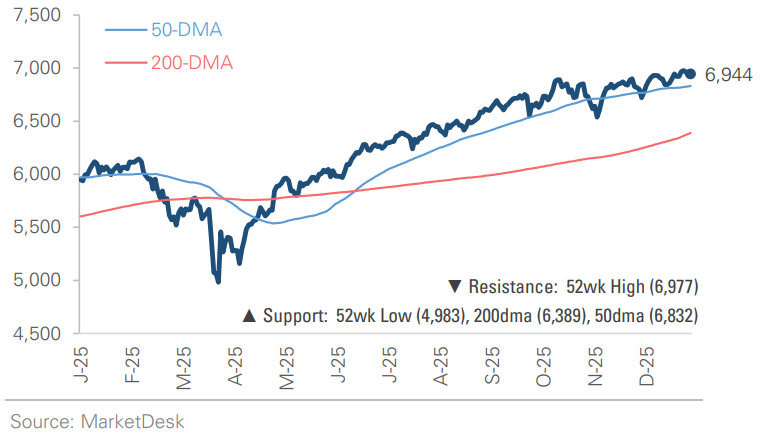
S&P 500 Index (Last 12 Months)
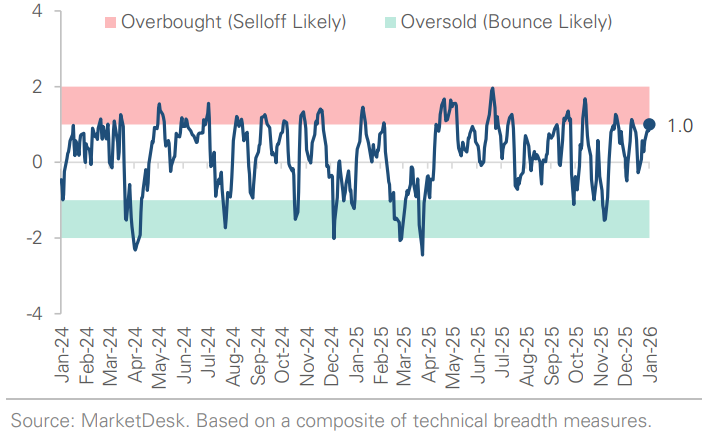
S&P 500 Technical Composite (Last 24 Months)
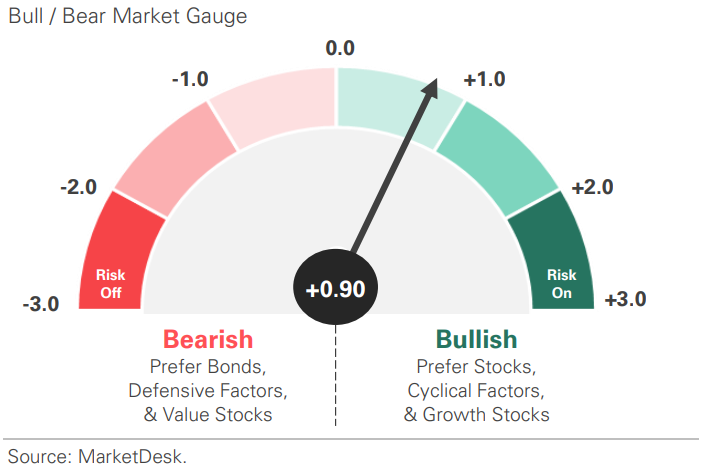
US Risk Demand Market Indicator
The US Risk Demand Indicator (USRDI) is a quantitative tool to measure real-time investor risk appetite. When the indicator is above zero, it signals a risk-on environment favoring cyclical sectors, high beta stocks, high-yield corporate bonds, and hybrid (convertible) bonds. In contrast, a reading below zero signals a risk-off environment favoring defensive sectors, low-volatility stocks, and US Treasury bonds.
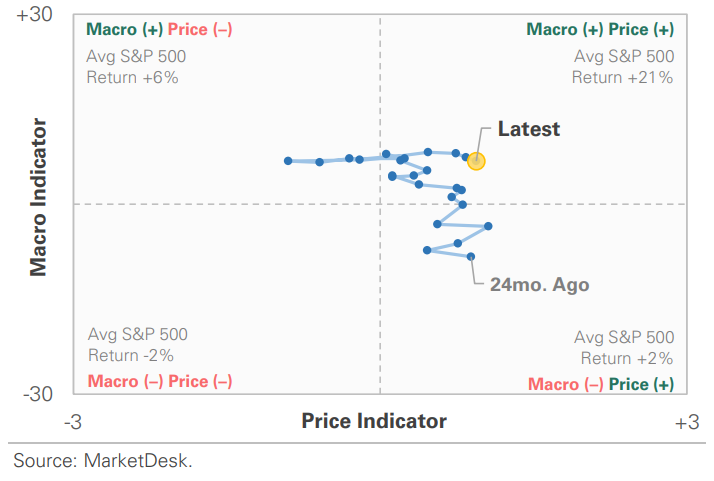
US Market Economic Cycle Indicator
The Market Cycle Indicator tracks two primary investor groups: macro investors and price-based investors. Macro investors rely on fundamental and economic data to guide their decisions, while price-based investors (or technical analysts) focus on price action, momentum, volume, and behavioral trends. The Indicator synthesizes these perspectives to identify the prevailing market regime.
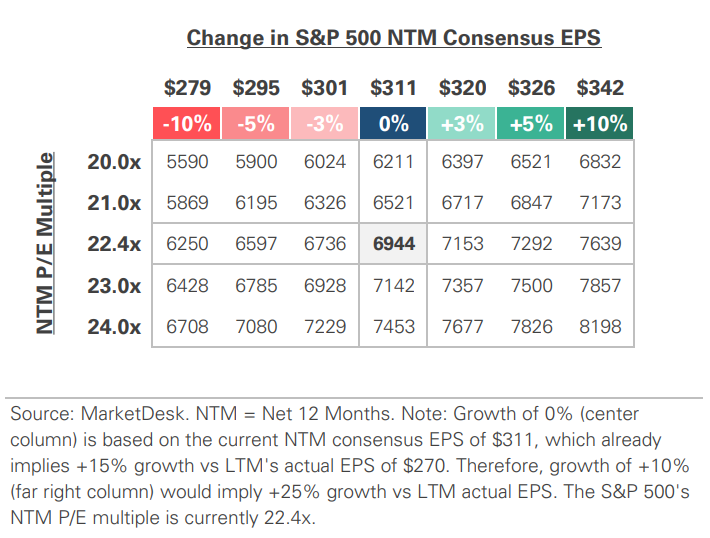
S&P 500 Valuation Matrix
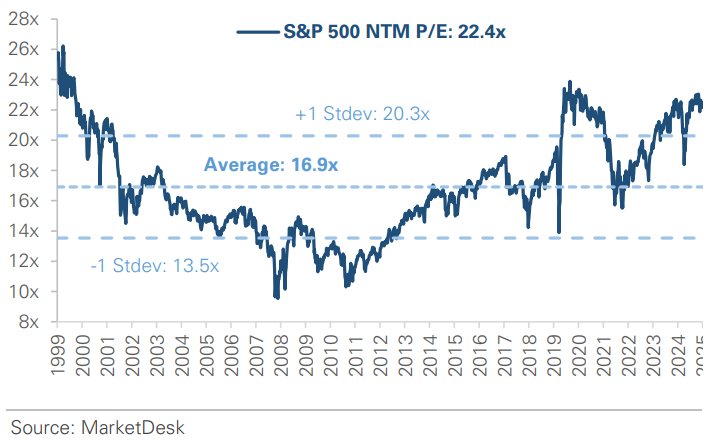
S&P 500 Forward PE Ratio
The S&P 500 forward price-to-earnings (P/E) ratio is a widely followed valuation metric that compares the index's current level to the projected earnings of its constituent companies over the next 12 months. The indicator implies to investors how much they are paying today for each dollar of expected future earnings.
Key Takeaways
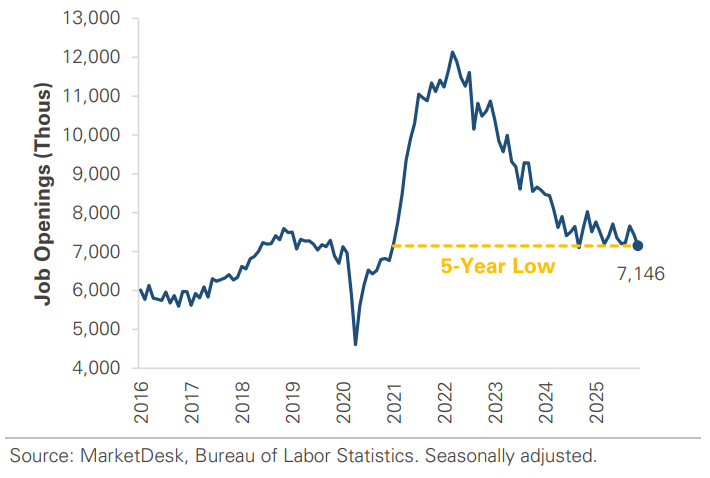
#1 - Jobs Data Show Labor Market Conditions Cooling
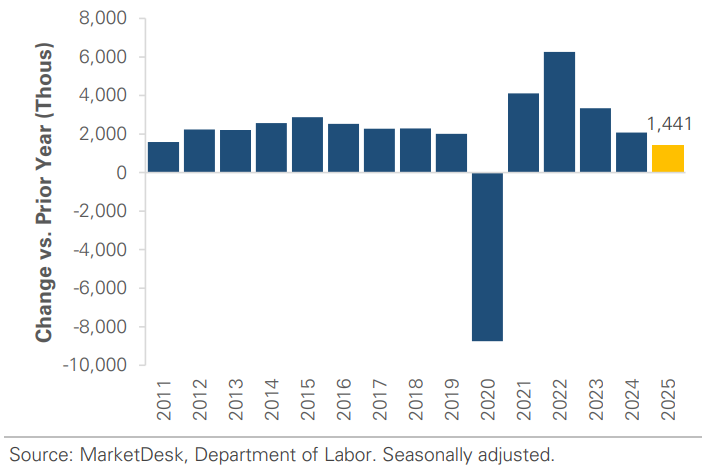
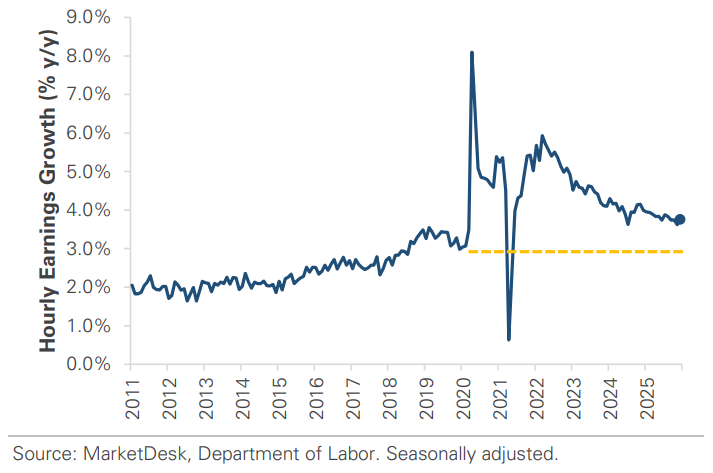
December jobs data showed that labor market conditions continue to cool. US companies added 50,000 jobs last month, slightly below expectations, with unemployment falling from 4.6% to 4.4%. Excluding the pandemic, 2025 was the slowest year of job growth since 2010. Despite softer job growth, wage gains remained solid at 0.3% month-over-month and 3.8% year-over-year, keeping inflation concerns in focus.
Implication: The combination of slowing job gains and steady wage growth leaves the outlook for rate cuts uncertain. Labor conditions have cooled but remain solid, while wage growth remains elevated compared to pre-pandemic levels.
2025 Was the Slowest Year of Job Growth Since 2010
Wage Growth Remains Above Pre-Pandemic Trend
#2 - Mixed Signals From Inflation and Consumer Spending Data
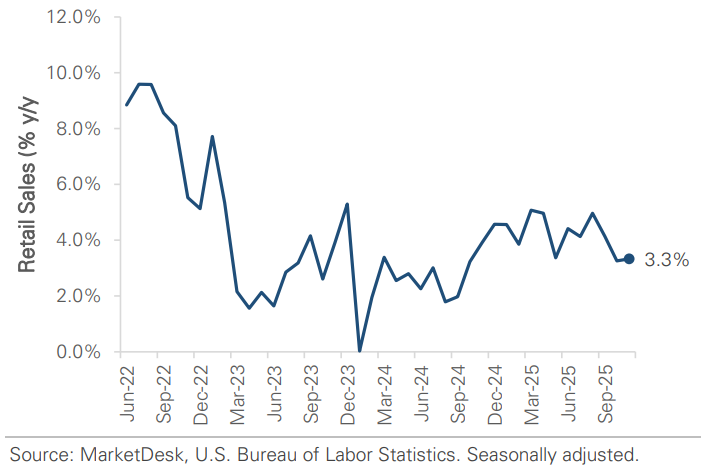
Later in the week, inflation and consumer spending data provided mixed signals. Core CPI rose 0.2% month over month in December, below expectations and in line with September 2025, the last release before the government shutdown. Retail sales rose +0.6% in November, above forecast and the highest since August 2025.
Implication: Inflation continues to moderate, while consumer spending remains resilient. These conflicting signals have kept markets in a holding pattern and reinforced the view that neither growth nor inflation is providing a clear direction for Fed policy.
Inflation Remains Below Post-Pandemic Highs
Retail Sales Growth Remains Strong
#3 - Fed Policy
The near-term policy outlook has become clearer, but the outlook for later this year remains uncertain. The Fed’s next meeting is the last week of January, and markets place a nearly 100% probability that rates will remain unchanged. No rate cuts are expected at the March or April meetings either, with the next rate cut anticipated in June. The market is pricing in a similar rate-cut timeline to last year, with a pause in the first half and potential cuts later in the year.
Implication: The week ended with unresolved expectations for Fed policy, keeping markets in a holding pattern and driving a rotation across asset classes.
Year-to-Date Price Returns Across Asset Classes
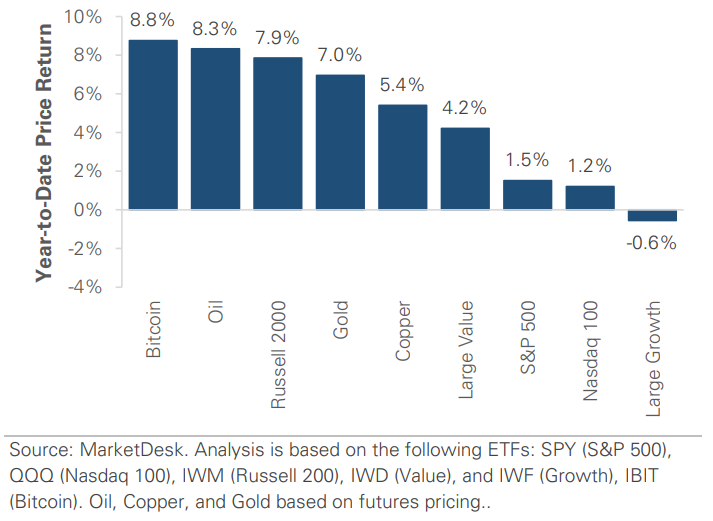
#4 -Market Leadership Continues to Rotate
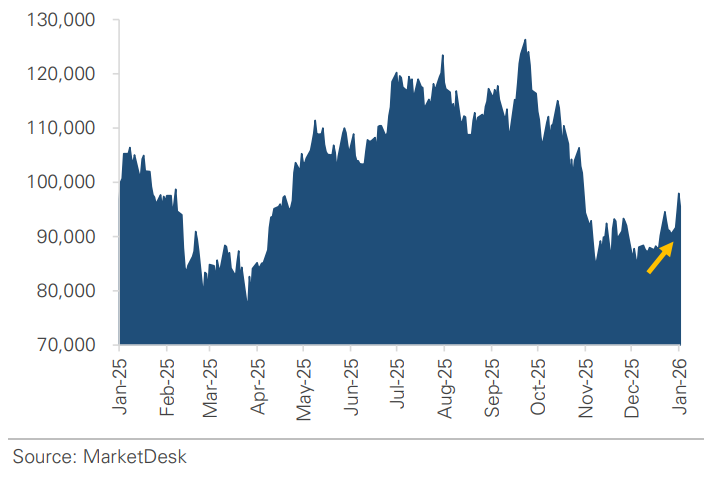
Market leadership continued to rotate this week. The S&P 500 posted a modest gain, but there was a clear rotation beneath the surface, with small-cap stocks outperforming for a second consecutive week. Commodities and cryptocurrencies posted strong gains, with sometimes conflicting signals, as gold, oil, and bitcoin traded higher together. The continued equity market rotation and lack of a unified risk-on or risk-off pattern across asset classes underscored the week’s theme of fragmentation and cross-asset inconsistency.
Implication: The mixed results across equities, commodities, and crypto reflect a lack of consensus on major themes such as Fed policy and economic growth.
Bitcoin Climbs to a 3-Month High
#5 - Government Policy and Geopolitical Headlines
Government policy and geopolitical headlines contributed to the unsettled market tone this week. The White House announced an investigation of Fed Chair Powell, raising concerns about the Fed's credibility and independence. There were proposals to buy mortgage-backed securities to lower mortgage rates and ease housing pressures, as well as to cap credit card fees. Meanwhile, renewed tensions with Iran added to commodity volatility, particularly in oil, but did not drive a broader flight to safety.
Implication: The market is digesting a steady stream of policy and regulatory headlines, but they haven’t sparked a clear reaction. Instead, they’re viewed as background noise or filed away as longer-term considerations with no immediate market impact.
Important Disclosures
This material is provided for general and educational purposes only and is not investment advice. Your investments should correspond to your financial needs, goals, and risk tolerance. Please consult an investment professional before making any investment or financial decisions or purchasing any financial, securities, or investment-related service or product, including any investment product or service described in these materials.
Our Insights