
Fed Meeting, August Inflation, and Rising Interest Rates

Photo Credit: Federal Reserve, Flickr
Weekly Market Recap for September 18th
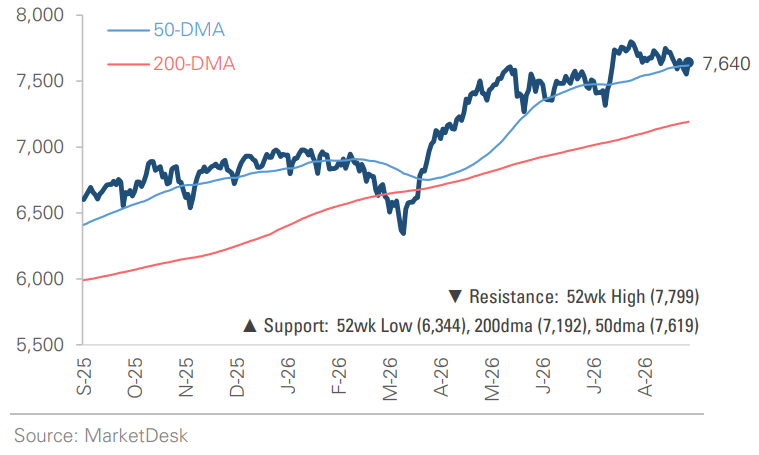
Markets finished modestly higher this week despite volatility around the Fed rate hike, Treasury yields, and oil. The S&P 500 gained +0.6%, and the Nasdaq rose +1.1%, while the Russell 2000 small-cap index slipped -0.3%. Growth (+1.0%) outpaced Value (+0.3%), while the Equal-Weight S&P 500 gained just +0.2%, signaling continued leadership from larger Growth stocks. Health Care (+1.9%) and Technology (+1.5%) led all S&P 500 sectors, while Utilities (-2.2%), Financials (- 1.5%), and Industrials (-0.8%) lagged. Bonds were mixed, with longer-maturity Treasuries gaining +1.1%, while shorter-maturity bonds fell -0.1%. In the corporate bond market, investment-grade bonds rose +0.6%, while high-yield gained +0.1%. The U.S. dollar strengthened +1.2%, oil declined -0.6% despite intra-week volatility, and the VIX ended the week flat.
S&P 500 Index (Last 12 Months)
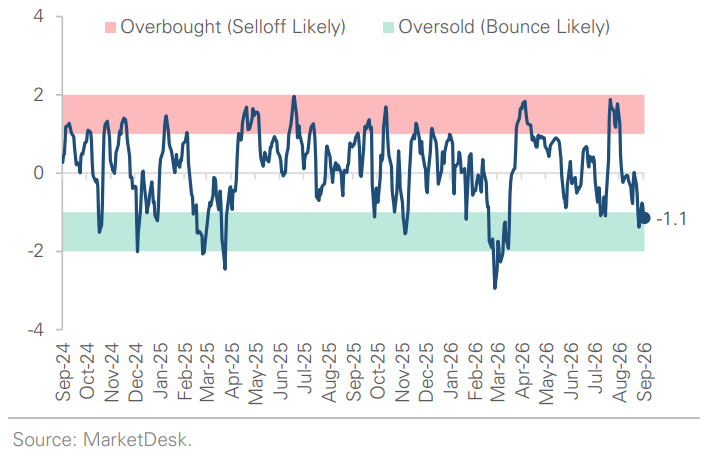
S&P 500 Technical Composite (Last 24 Months)
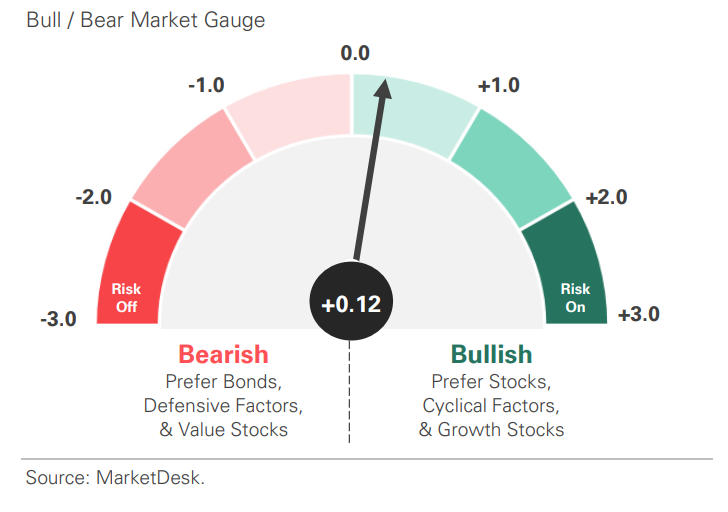
US Risk Demand Market Indicator
The US Risk Demand Indicator (USRDI) is a quantitative tool to measure real-time investor risk appetite. When the indicator is above zero, it signals a risk-on environment favoring cyclical sectors, high-beta stocks, high-yield corporate bonds, and hybrid (convertible) bonds. In contrast, a reading below zero signals a risk-off environment favoring defensive sectors, low-volatility stocks, and US Treasury bonds.
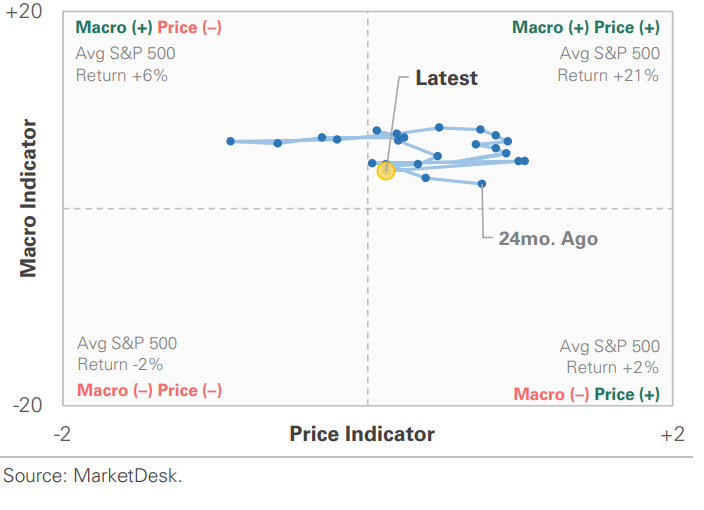
US Market Economic Cycle Indicator
The Market Cycle Indicator tracks two primary investor groups: macro investors and price-based investors. Macro investors rely on fundamental and economic data to guide their decisions, while price-based investors (or technical analysts) focus on price action, momentum, volume, and behavioral trends. The Indicator synthesizes these perspectives to identify the prevailing market regime.
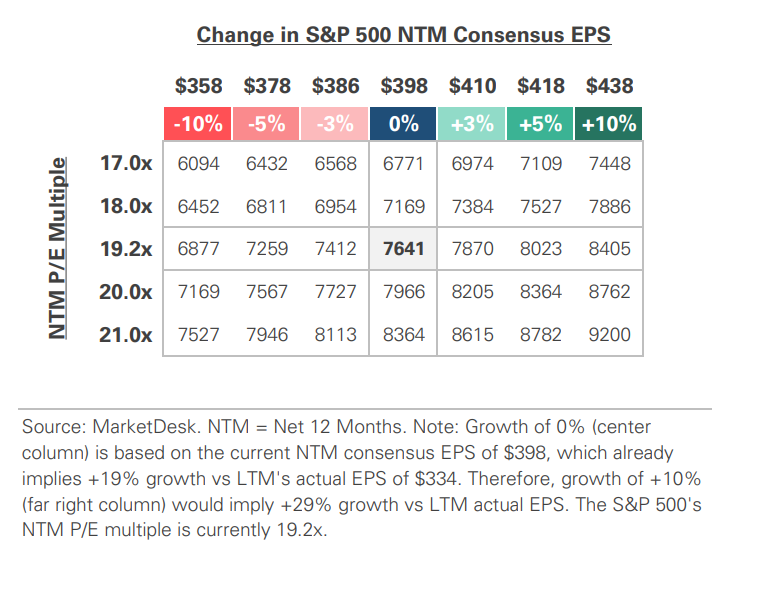
S&P 500 Valuation Matrix
S&P 500 Forward PE Ratio
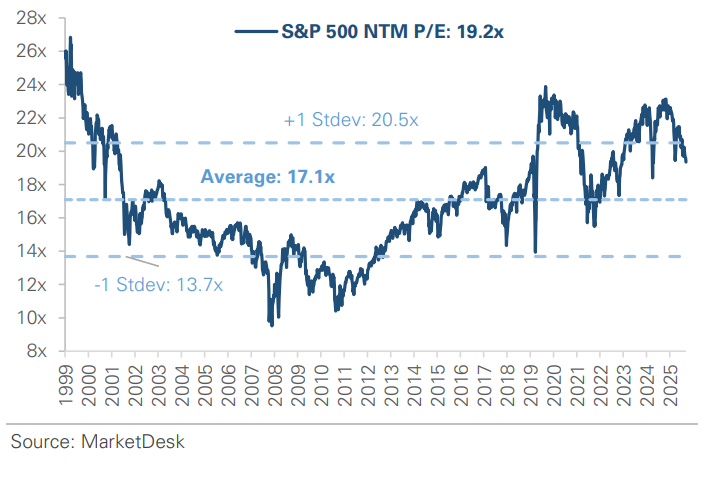
The S&P 500 forward price-to-earnings (P/E) ratio is a widely followed valuation metric that compares the index's current level to the projected earnings of its constituent companies over the next 12 months. The indicator implies to investors how much they are paying today for each dollar of expected future earnings.
Key Takeaways
#1 - Federal Reserve Raises Rates
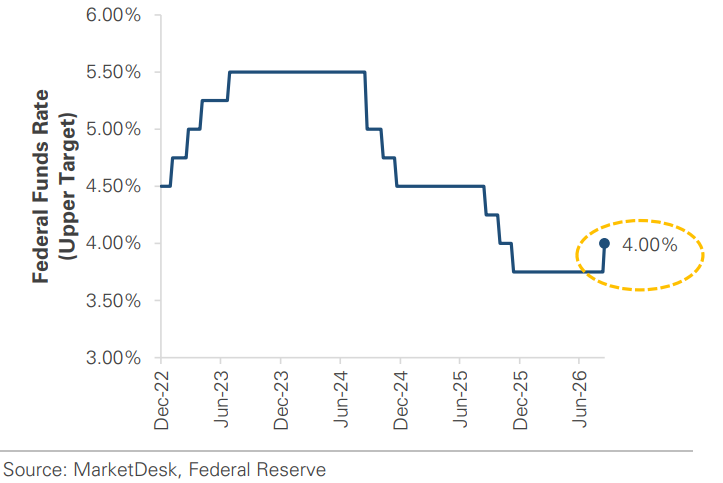
The Federal Reserve raised rates this week and signaled that additional tightening is possible. The Fed raised its benchmark rate by +0.25% to a range of 3.75%–4.00%, its first rate hike since 2023. Policymakers also raised their projected interest rate path, with the median year-end forecast rising to 4.1% from 3.8% in June. The Fed also raised its 2026 GDP growth forecast and lowered its unemployment rate forecast, highlighting an economy that remains relatively strong even as inflation stays above target. Markets also price in additional tightening, with futures implying another rate hike this year at either the October or December meeting.
Implication: Both policymakers and markets now see a higher interest-rate path than earlier this summer, even though the timing and extent of additional hikes remain uncertain.
Fed Raises Interest Rates for the First Time Since 2023.
#2 - Inflation Remains Elevated
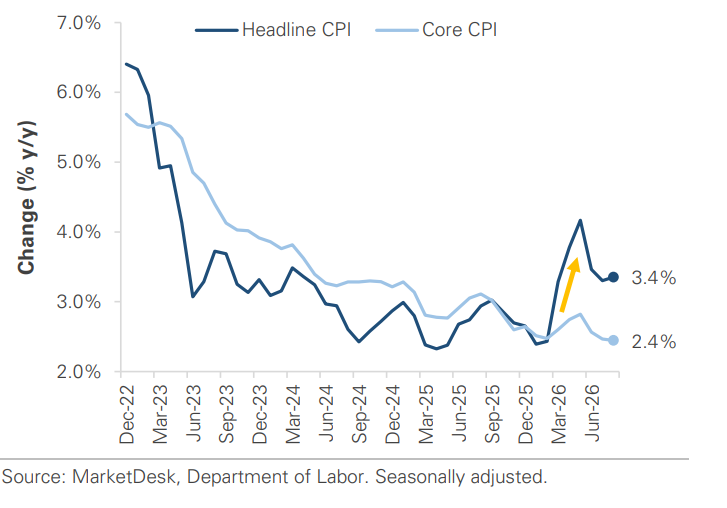
Inflation remained elevated in August, with energy responsible for most of the monthly increase. Consumer prices rose +0.4% month over month and +3.4% over the past year. Gasoline prices increased +3.9% during the month, accounting for more than one-third of the overall increase. Core inflation, which excludes the volatile food and energy categories, rose a more moderate +0.3% for the month and +2.4% from a year earlier. The gap between core and headline inflation suggests price pressures did not accelerate as broadly as the headline figure implies, although underlying inflation remained above the Fed’s target.
Implication: Higher energy costs have shifted from a market story to a measurable contributor to consumer inflation, reinforcing why price stability was central to this week’s Fed decision.
Elevated Inflation, Diverging CPI Trends.
#3 - Consumer Spending Rebounds
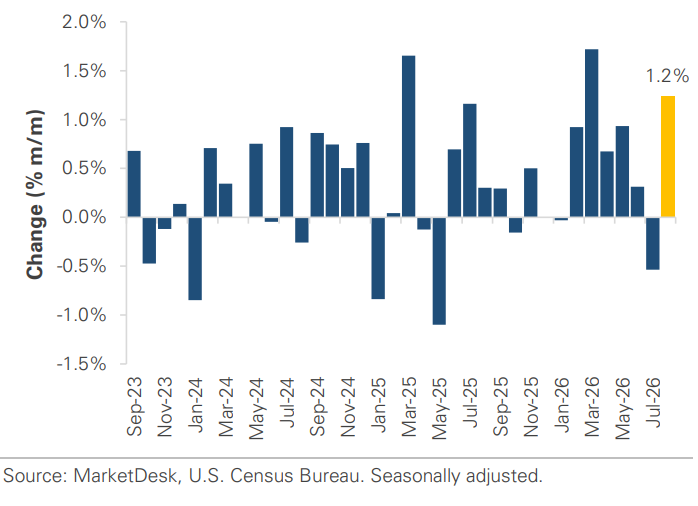
Retail sales rose +1.2% after declining in July, showing household demand remained resilient despite higher prices and borrowing costs. The increase wasn’t simply due to more expensive gasoline; sales excluding gasoline stations rose +1.1%, and online retailers and restaurants were among the strongest categories. The rebound eases some of the concern created by July’s softer report and supports the broader picture of an economy that is still expanding.
Implication: The data suggests consumers continue to spend, giving the Fed more room to focus on inflation, which remains above target.
Consumer Spending Regains Momentum
#4 - Treasury Yield Tops 5%
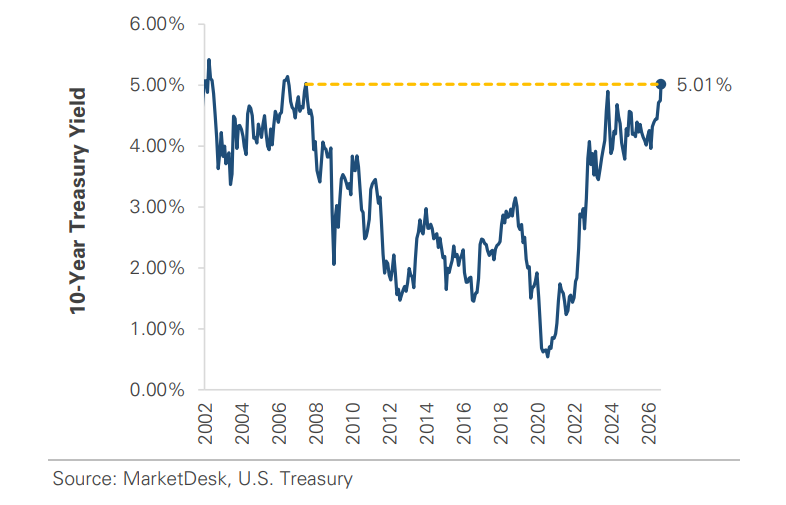
The 30-year yield briefly touched 5.40% before falling back, adding evidence of upward pressure on longer-term interest rates. Unlike the federal funds rate, which the Fed sets, longer-term yields are set in the bond market and can move independently of Fed decisions.
Implication: Higher long-term Treasury yields matter because they serve as benchmarks for borrowing costs across the economy, including mortgages and corporate debt.
10-Year Treasury Yield Rises Above 5%.
#5 - Higher Rates Pressure Housing
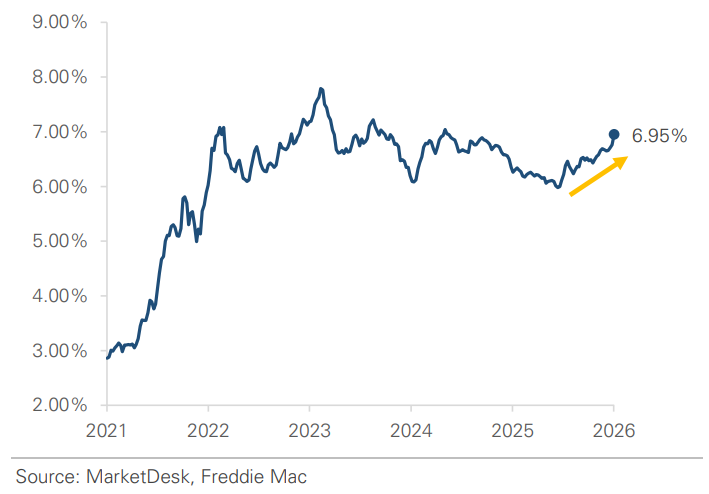
The average 30-year fixed mortgage rate is approaching 6.80%, up from 6.00% in early March. Housing starts declined -2.6% to a 1.27 million annual rate in August, while building permits fell -2.7% to 1.39 million. The report was not uniformly weak, as single-family starts increased, but overall construction activity remained subdued.
Implication – Housing shows how high interest rates are affecting rate-sensitive parts of the economy by making financing more expensive.
Average 30-Year Fixed Rate Mortgage Approaches 7%.
Important Disclosures
This material is provided for general and educational purposes only and is not investment advice. Your investments should correspond to your financial needs, goals, and risk tolerance. Please consult an investment professional before making any investment or financial decisions or purchasing any financial, securities, or investment-related service or product, including any investment product or service described in these materials.
Our Insights