Job Growth, Rising Oil Prices and Interest Rates, and Next Week's Fed Meeting

Photo Credit: Getty Images, Unsplash
Weekly Market Recap for September 11th
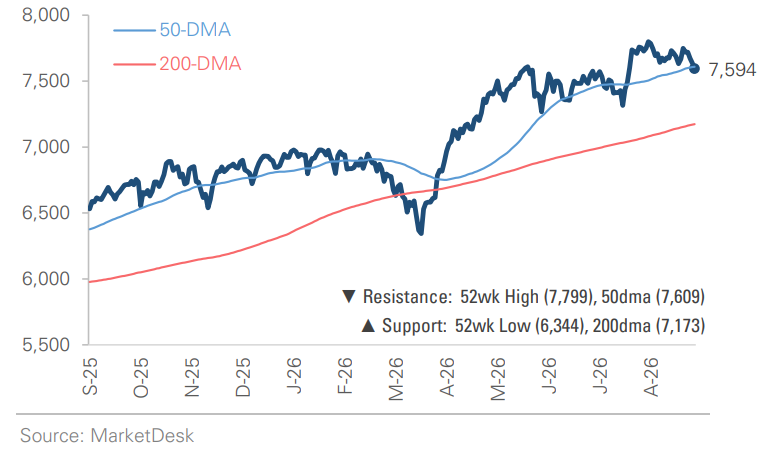
Markets traded lower this week as rising oil prices and long-term interest rates weighed on risk assets. The S&P 500 fell -2.0%, the Nasdaq declined -1.2%, and the Russell 2000 small-cap index returned -2.6%. Growth (-1.7%) outperformed Value (-2.4%), while the Equal-Weight S&P 500 fell -3.1%, signaling broad weakness beneath the major indexes. Energy (+0.7%) was the only sector to finish higher, while Technology was nearly flat. Health Care (-4.3%), Consumer Discretionary (-3.9%), and Materials (-3.6%) led the downside. Bonds declined as Treasury yields rose, with long-maturity Treasuries falling -1.7% and the 10-year yield approaching 5%. Corporate bonds also declined but outperformed Treasuries. Oil surged +12.5%, volatility increased, the U.S. dollar was little changed, and Bitcoin fell nearly -6% after a +20% rally.
S&P 500 Index (Last 12 Months)
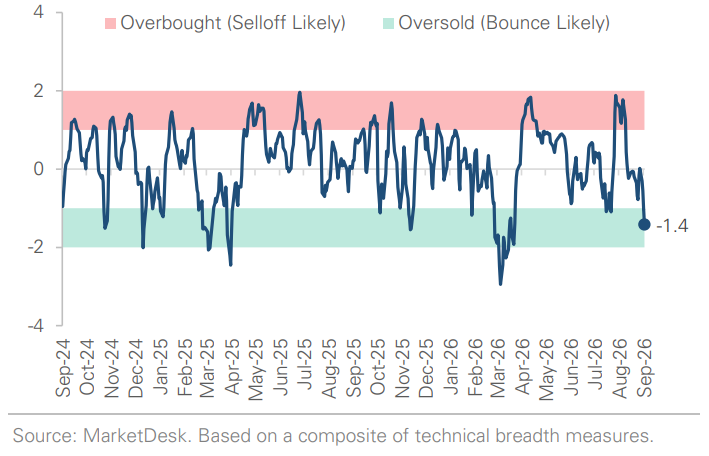
S&P 500 Technical Composite (Last 24 Months)
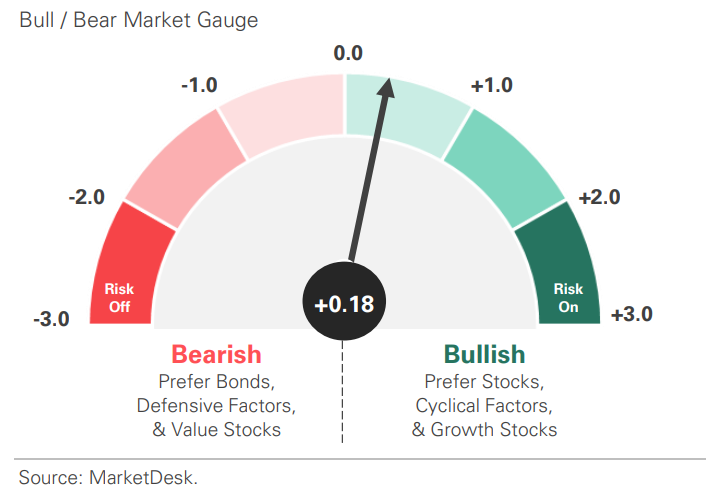
US Risk Demand Market Indicator
The US Risk Demand Indicator (USRDI) is a quantitative tool to measure real-time investor risk appetite. When the indicator is above zero, it signals a risk-on environment favoring cyclical sectors, high-beta stocks, high-yield corporate bonds, and hybrid (convertible) bonds. In contrast, a reading below zero signals a risk-off environment favoring defensive sectors, low-volatility stocks, and US Treasury bonds.
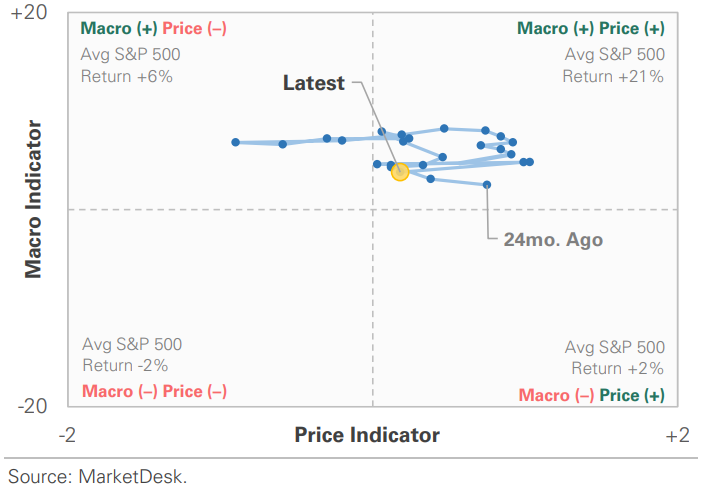
US Market Economic Cycle Indicator
The Market Cycle Indicator tracks two primary investor groups: macro investors and price-based investors. Macro investors rely on fundamental and economic data to guide their decisions, while price-based investors (or technical analysts) focus on price action, momentum, volume, and behavioral trends. The Indicator synthesizes these perspectives to identify the prevailing market regime.
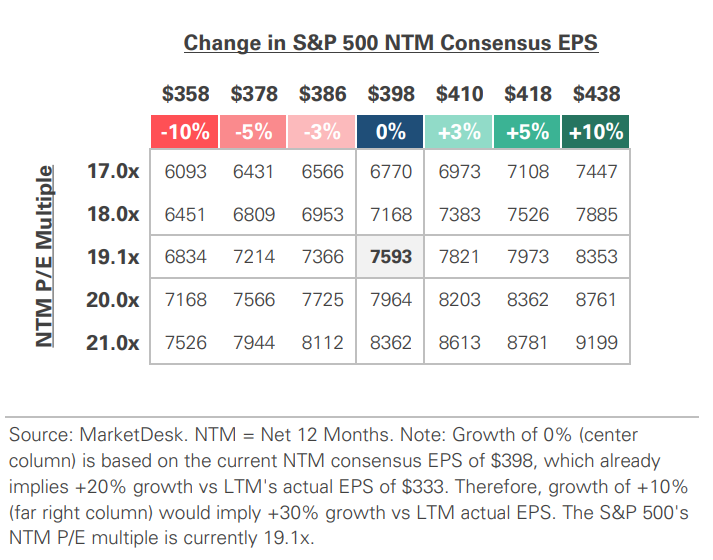
S&P 500 Valuation Matrix
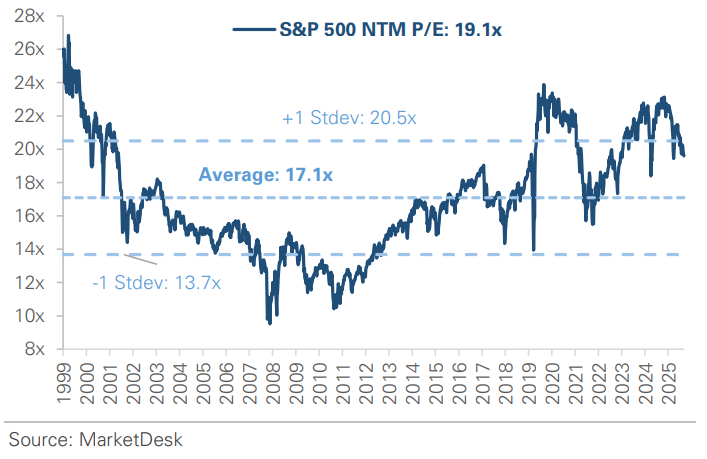
S&P 500 Forward PE Ratio
The S&P 500 forward price-to-earnings (P/E) ratio is a widely followed valuation metric that compares the index's current level to the projected earnings of its constituent companies over the next 12 months. The indicator implies to investors how much they are paying today for each dollar of expected future earnings.
Key Takeaways
#1 - Labor-Market Conditions
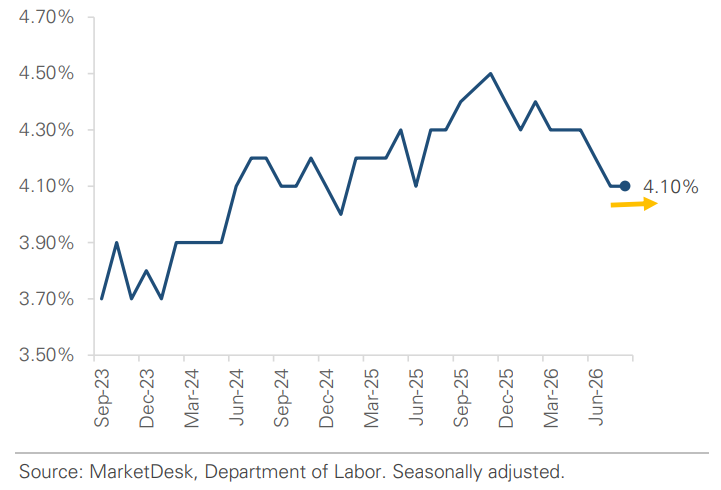
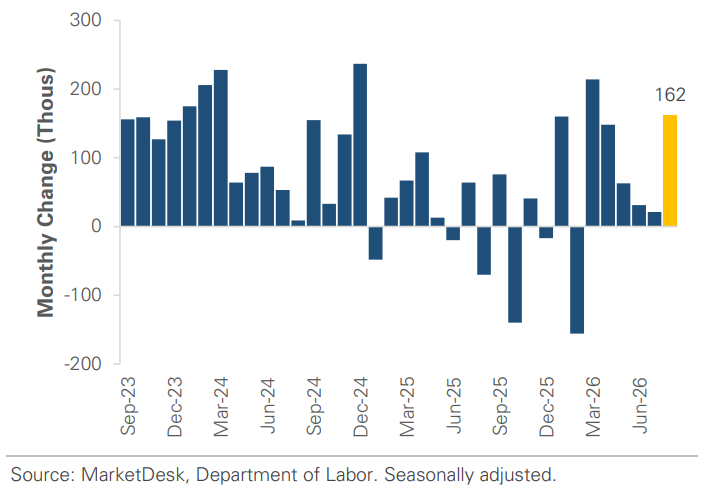
Labor-market conditions improved in August after several weak hiring months. Employers added +162,000 jobs, while the unemployment rate held at 4.1%. Prior months also improved after revisions: June payroll growth rose to +31,000 from +20,000, and July was revised from an initially reported -23,000 jobs to +21,000. Combined, the revisions added +55,000 jobs to the previous two months. The report does not suggest the labor market has returned to the strength of earlier years, but it paints a less concerning picture than investors saw after July’s initial release.
Implication: The labor market still appears to be cooling, but August suggests that deterioration is occurring more gradually than previously feared.
Unemployment Held Steady in August
Job Growth Rebounds
#2 - Middle East Conflict Continues
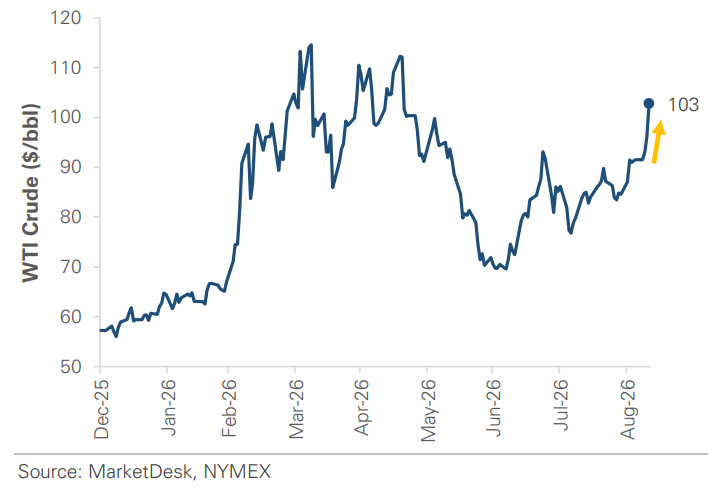
Oil prices moved sharply higher as fighting intensified and disruptions to energy shipments through the Strait of Hormuz continued. U.S. crude moved back above $100 per barrel after falling substantially earlier in the summer. More importantly, repeated escalations make it harder to assume each increase in energy prices will quickly unwind.
Implication: The longer the disruption persists, the more relevant energy becomes as an ongoing source of inflation uncertainty rather than a series of isolated weekly price swings.
Oil Trades Back Above $100 Per Barrel
#3 - Global Bond Yields Rise
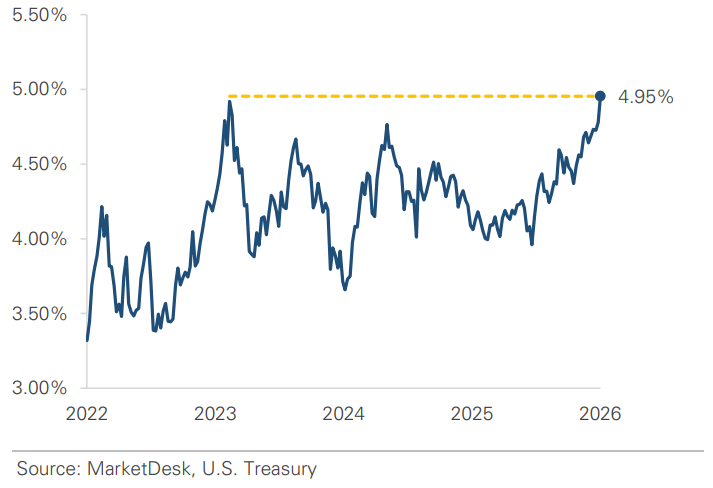
The 10-year Treasury yield climbed above 4.90% this week, its highest level since October 2023, while the 30-year moved above 5.3%. Government-bond yields also rose across several major developed markets as investors weighed inflation, higher energy costs, government borrowing needs, and tighter monetary policy. The breadth of the move suggests that higher long-term rates are not simply a reaction to one U.S. economic report or a shift in Fed expectations.
Implication: A wider set of global forces is putting upward pressure on long-term borrowing costs, making it harder to attribute elevated yields to any single economic report or shift in central-bank policy.
10-Year Yield Rises to Highest Level Since 2023
#4 - Rate Hike Expectations Build
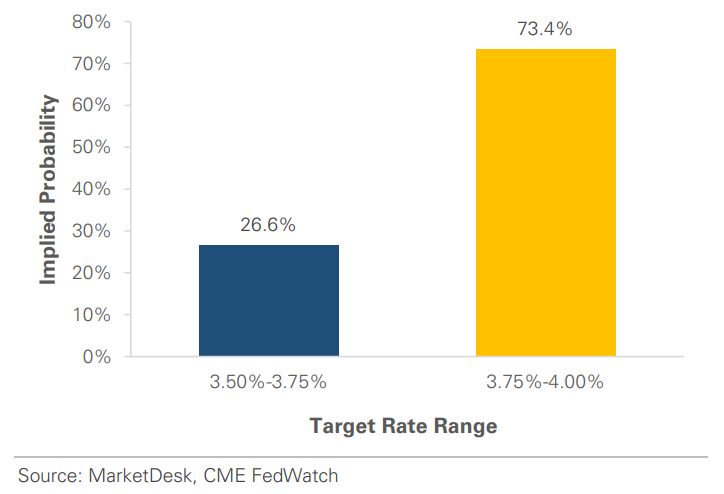
The Fed held rates at 3.50%–3.75% in July, although three policymakers preferred a +0.25% hike. At Jackson Hole, Chair Warsh described the labor market as stable and said inflation should remain the Fed’s predominant focus. Since then, stronger August job growth, higher oil prices, and renewed producer-price pressure have strengthened the case for a rate hike. Futures markets now price in roughly a 70% probability of a +0.25% move at the September 15–16 meeting.
Implication: Next week’s decision will show whether firmer labor data and persistent inflation pressure have been enough to move the Fed from considering a rate hike to delivering one.
Markets Forecast a Rate Hike Next Week
#5 - AI Infrastructure Spending Resilient
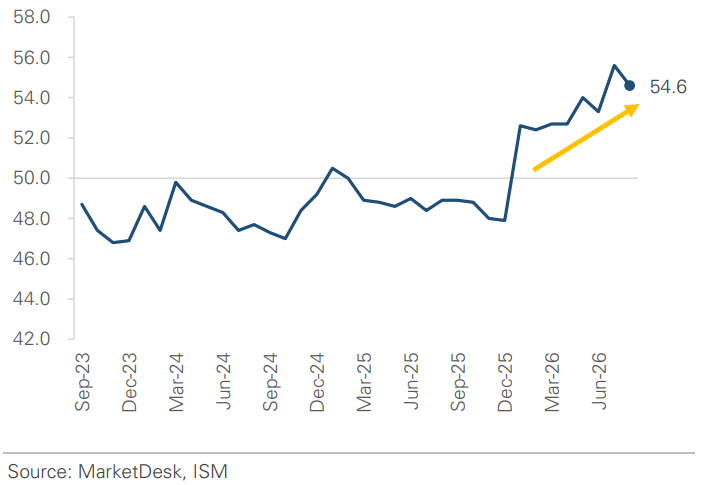
Oil prices and long-term yields have risen, inflation pressure has increased, and the market expects a Fed hike. Those shifts would normally make large capital projects more expensive and could lead companies to reconsider spending plans. So far, however, the largest tech companies have continued committing substantial capital to data centers, computing capacity, and other AI infrastructure.
Implication – AI investment has become a significant contributor to both economic growth and corporate earnings, and so far, the largest tech companies appear willing to continue that spending despite volatility in rates, energy prices, and inflation.
Manufacturing Survey Continues to Signal Expansion
Important Disclosures
This material is provided for general and educational purposes only and is not investment advice. Your investments should correspond to your financial needs, goals, and risk tolerance. Please consult an investment professional before making any investment or financial decisions or purchasing any financial, securities, or investment-related service or product, including any investment product or service described in these materials.
Our Insights