

Photo Credit: Arvind Vallabh
Weekly Market Recap for August 28th
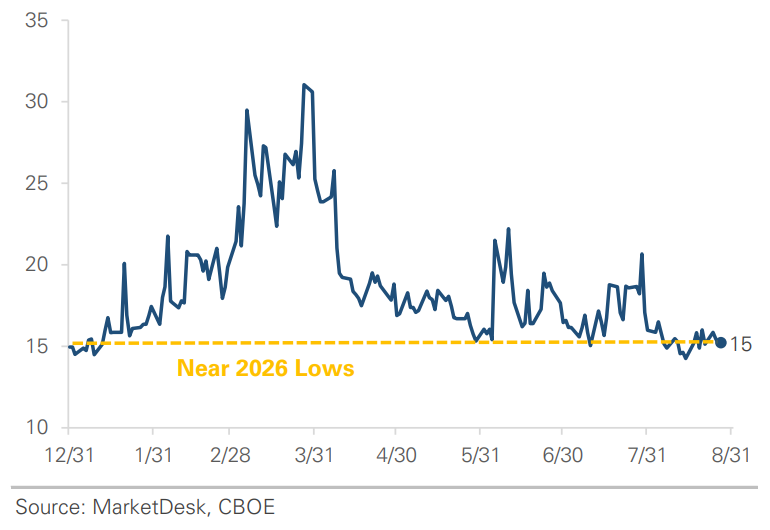
This week, markets traded higher this week as oil and long-term Treasury yields pulled back after rising last week. The S&P 500 gained +1.2%, the Nasdaq rose +1.2%, and the Russell 2000 small-cap index returned +0.8%. Growth (+1.6%) outperformed Value (+0.6%), while the Equal-Weight S&P 500 gained +0.6%, signaling leadership from the largest stocks. Technology led all sectors with a +2.7% return, followed by Materials (+1.7%) and Financials (+1.6%). Energy (-2.2%) was the weakest sector as oil declined -3.6%. Bonds rebounded as Treasury yields declined, with long-maturity Treasuries gaining +0.9% while shorter-maturity bonds were flat. Corporate bonds rose but trailed Treasuries, with investment-grade outperforming high-yield. Volatility eased in the equity and bond markets, the U.S. dollar strengthened modestly, and Bitcoin rose nearly +10%.
S&P 500 Index (Last 12 Months)
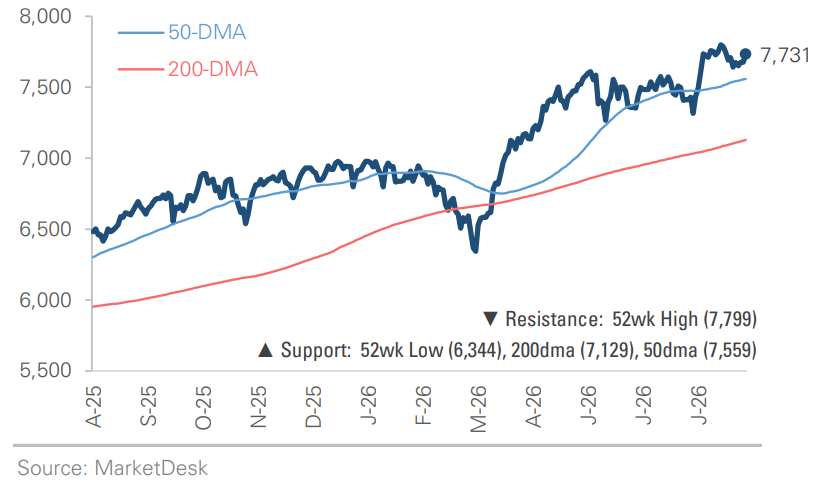
S&P 500 Technical Composite (Last 24 Months)
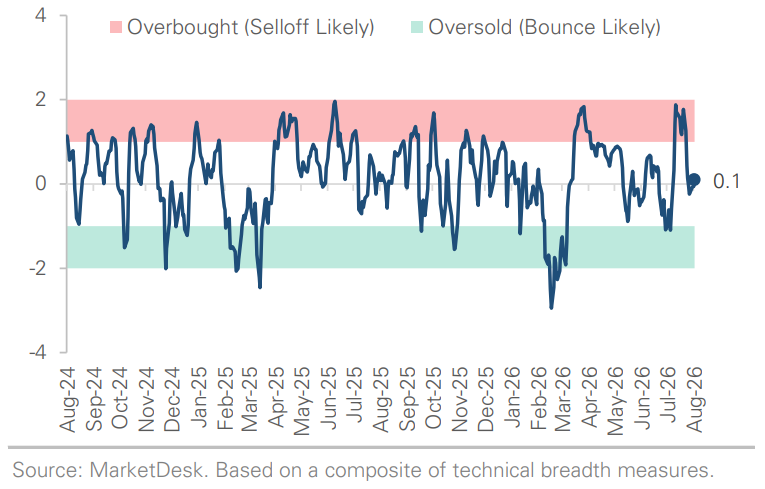
US Risk Demand Market Indicator
The US Risk Demand Indicator (USRDI) is a quantitative tool to measure real-time investor risk appetite. When the indicator is above zero, it signals a risk-on environment favoring cyclical sectors, high-beta stocks, high-yield corporate bonds, and hybrid (convertible) bonds. In contrast, a reading below zero signals a risk-off environment favoring defensive sectors, low-volatility stocks, and US Treasury bonds.
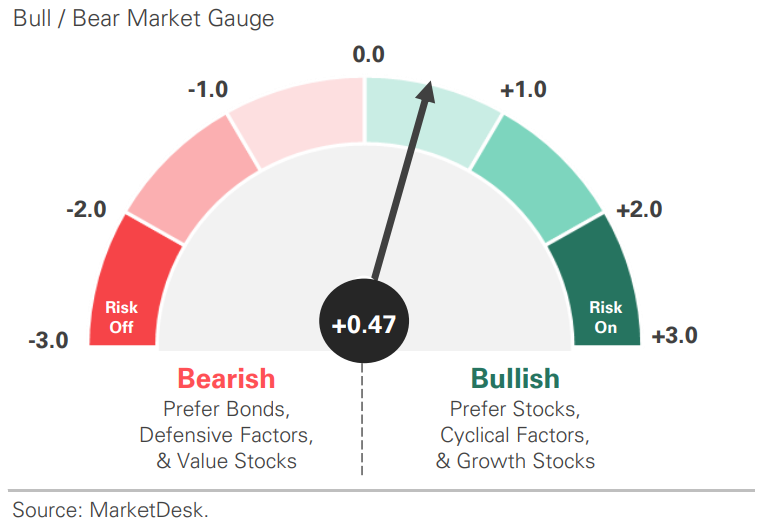
US Market Economic Cycle Indicator
The Market Cycle Indicator tracks two primary investor groups: macro investors and price-based investors. Macro investors rely on fundamental and economic data to guide their decisions, while price-based investors (or technical analysts) focus on price action, momentum, volume, and behavioral trends. The Indicator synthesizes these perspectives to identify the prevailing market regime.
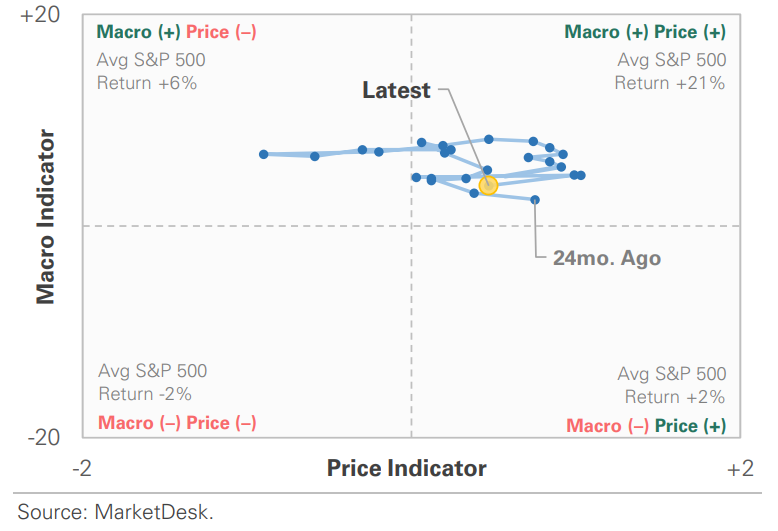
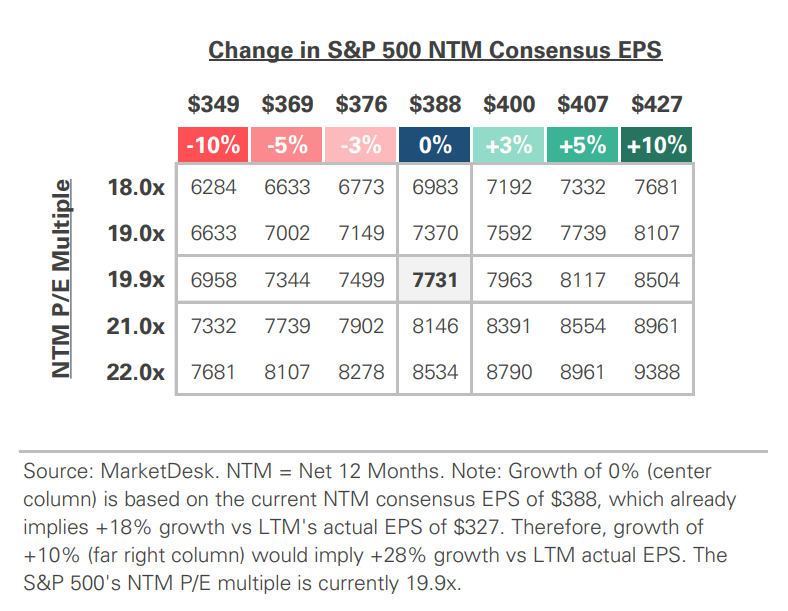
S&P 500 Valuation Matrix
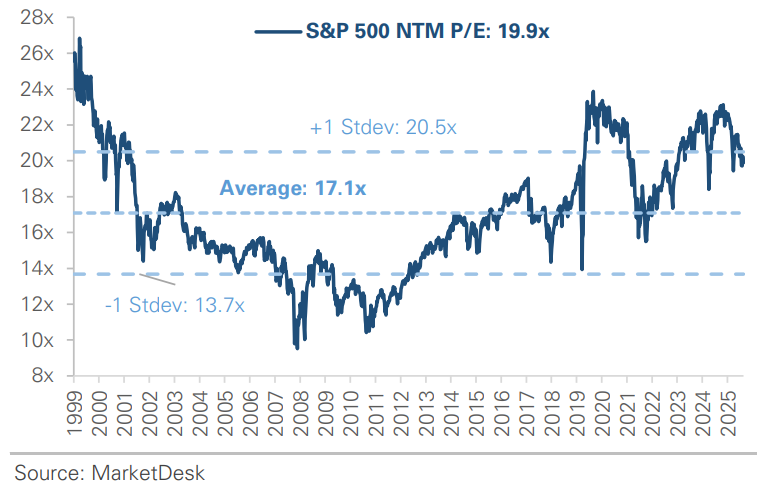
S&P 500 Forward PE Ratio
The S&P 500 forward price-to-earnings (P/E) ratio is a widely followed valuation metric that compares the index's current level to the projected earnings of its constituent companies over the next 12 months. The indicator implies to investors how much they are paying today for each dollar of expected future earnings.
Key Takeaways
#1 - Oil Prices and Treasury Yields Pull Back
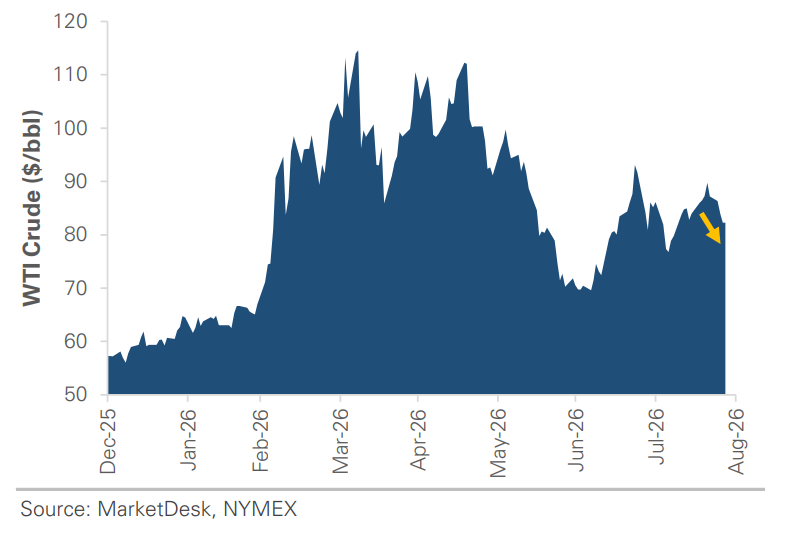
Oil prices and long-term Treasury yields both pulled back this week. Two of last week’s biggest sources of market pressure moved in the opposite direction. Brent crude fell from the mid-$90s to ~$88 as concerns around the Strait of Hormuz eased. Treasury yields also declined, with the 30-year yield falling from about 5.27% to roughly 5.17%. The moves provided some relief after rising energy prices and borrowing costs weighed on stocks last week.
Implication: The reversal eased some of the near-term pressure on inflation expectations and financial conditions, although both oil prices and long-term interest rates remain elevated.
Oil Prices Pull Back But Remain Elevated
VIX Index Remains Near a 2026 Low
#2 - Private Demand Remains Strong
Underlying private demand remained stronger than the headline GDP figure suggests. The second Q2 estimate showed the U.S. economy grew at a +1.5% annualized rate, unchanged from the initial estimate and down from +2.1% in Q1. However, real final sales to private domestic purchasers, which measure consumer spending and private fixed investment, were revised higher to +4.2% from +3.9%. The gap reflects several drags on headline GDP, including declining government spending and increased imports, that don’t necessarily indicate weak private demand.
Implication: The headline growth rate understated the strength of underlying private demand, making the Q2 slowdown less broad than the +1.5% figure suggests.
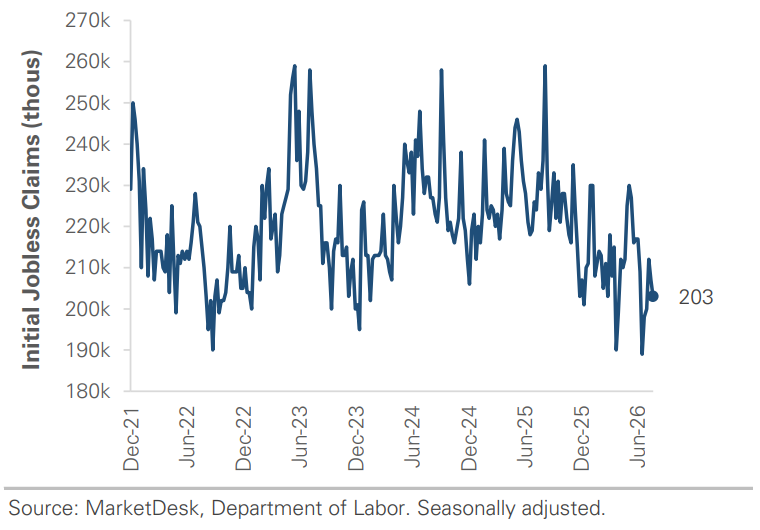
Initial Jobless Claims Remain Historically Low
#3 - Business Investment And Orders Remain Firm
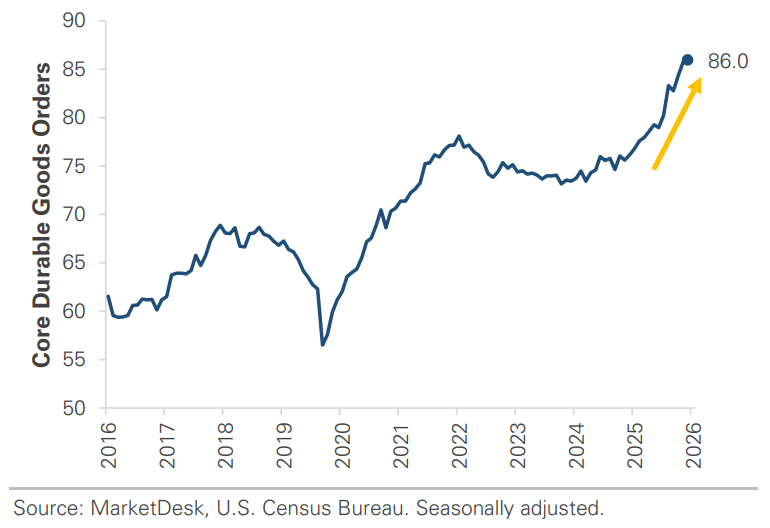
Business investment and equipment orders remained firm in July. Durable-goods orders rose +1.1%, while orders excluding the volatile transportation category increased +0.4%. Nondefense capital goods orders, excluding aircraft, a closely watched proxy for business investment, also rose and remained near recent highs. The monthly increase was modest, but the broader trend has strengthened since the spring, extending the underlying resilience visible in Q2 GDP.
Implication: Business investment continues to stand out as a relatively strong part of an otherwise uneven economic backdrop.
Core Durable Goods Orders Continue to Rise
#4 - New Home Sales Slow
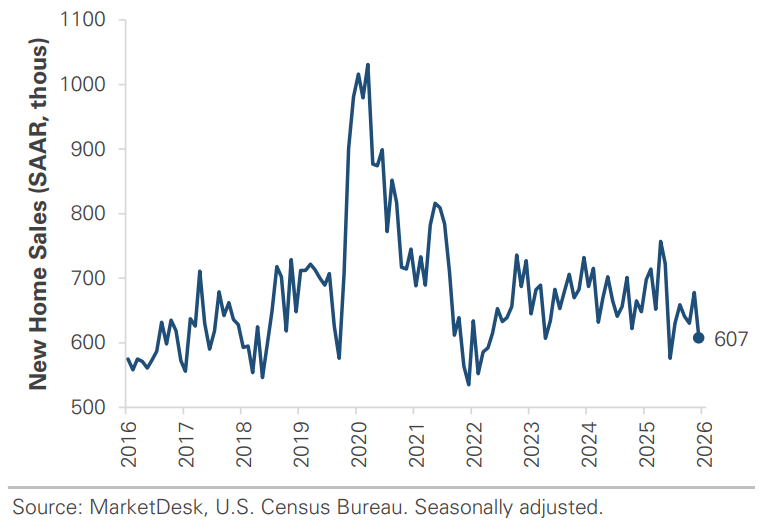
New home sales have fallen back to pre-pandemic levels as high borrowing costs weigh on demand. Sales of new single-family homes fell 10.5% in July to a 607,000 annual rate, down from 678,000 in June and 6.3% from a year earlier. The pace of sales is now roughly in line with the years immediately before the pandemic, when sales averaged around 600,000 to 680,000 annually. The supply of new homes rose to 9.6 months at the current sales pace as mortgage rates remained in the mid-6% range, keeping monthly payments elevated even as builders cut prices or offered incentives.
Implication: Housing is one of the clearest areas where higher longterm interest rates are translating into weaker real economic activity.
New Home Sales Return to Pre-Pandemic Levels
#5 - NVIDIA Confirms Demand for AI Infrastructure
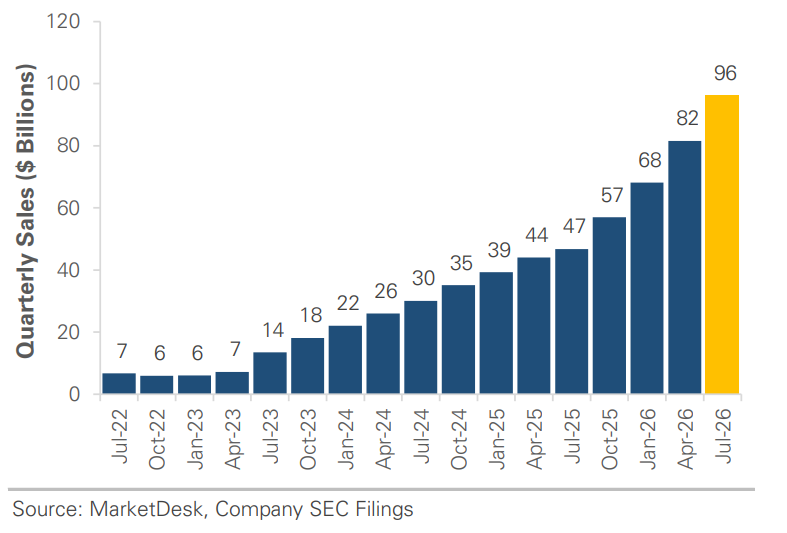
Nvidia’s latest results confirmed that demand for AI infrastructure remains strong. Nvidia reported quarterly revenue of $96.2 billion, more than double a year earlier, with data-center revenue climbing to $89.0 billion. The company projected $108 billion in revenue for the current quarter, even without assuming any China data center sales. The results reinforce an important distinction: investors continue to debate whether the enormous sums being spent on artificial intelligence will generate adequate returns, but demand for the infrastructure supporting that investment has shown little sign of slowing.
Implication – The AI buildout continues to expand rapidly even as the market debates whether the growth will eventually justify the cost.
NVIDIA’s Results Signal Strong AI Demand
Important Disclosures
This material is provided for general and educational purposes only and is not investment advice. Your investments should correspond to your financial needs, goals, and risk tolerance. Please consult an investment professional before making any investment or financial decisions or purchasing any financial, securities, or investment-related service or product, including any investment product or service described in these materials.
Our Insights