Job Growth, Inflation, Fed Policy, Demand for AI Computer Power, and Small Business Sentiment

Photo Credit: Getty Images Unsplash
Weekly Market Recap for August 14th
This week, markets traded higher for a third consecutive week. The S&P 500 gained +1.2%, the Nasdaq 100 rose +2.4%, and the Russell 2000 small-cap index returned +1.8%, with the S&P 500 and Russell 2000 both setting new all-time highs. The Growth and High Beta factors led the market, while the equal-weight S&P 500 also gained +1.9%, signaling broad market participation. Technology stocks rose +2.9%, while Energy led all sectors as oil prices rose nearly +5%. International stocks performed in line with U.S. stocks, while the U.S. dollar held steady. Bonds traded higher as markets reduced expectations for another Fed rate hike, with shorter-maturity bonds outperforming longer-maturity bonds. Gold prices continued to drift higher, while the VIX fell below 15 and sits near a year-to-date low.
S&P 500 Index (Last 12 Months)
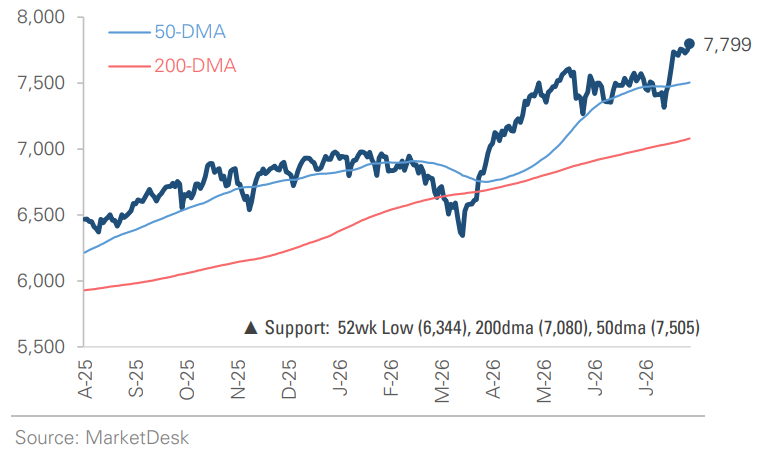
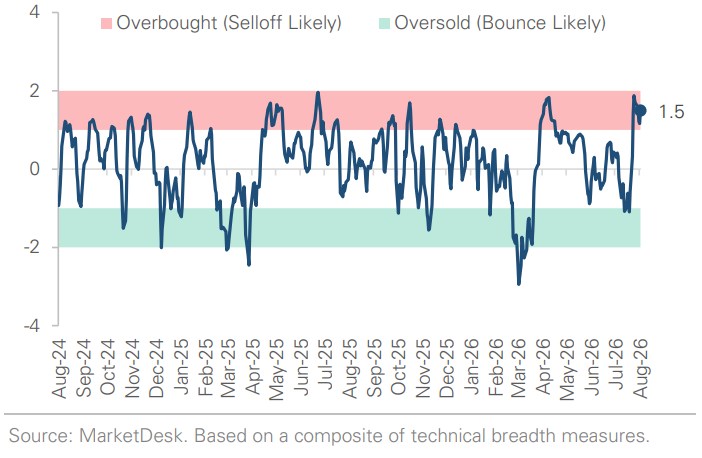
S&P 500 Technical Composite (Last 24 Months)
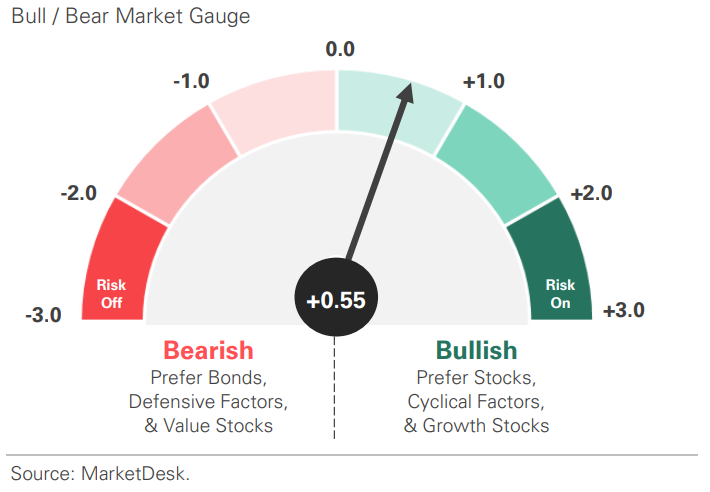
US Risk Demand Market Indicator
The US Risk Demand Indicator (USRDI) is a quantitative tool to measure real-time investor risk appetite. When the indicator is above zero, it signals a risk-on environment favoring cyclical sectors, high-beta stocks, high-yield corporate bonds, and hybrid (convertible) bonds. In contrast, a reading below zero signals a risk-off environment favoring defensive sectors, low-volatility stocks, and US Treasury bonds.
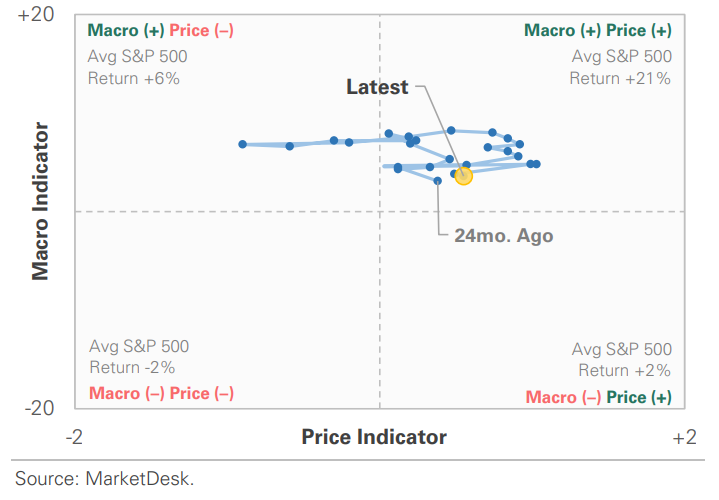
US Market Economic Cycle Indicator
The Market Cycle Indicator tracks two primary investor groups: macro investors and price-based investors. Macro investors rely on fundamental and economic data to guide their decisions, while price-based investors (or technical analysts) focus on price action, momentum, volume, and behavioral trends. The Indicator synthesizes these perspectives to identify the prevailing market regime.
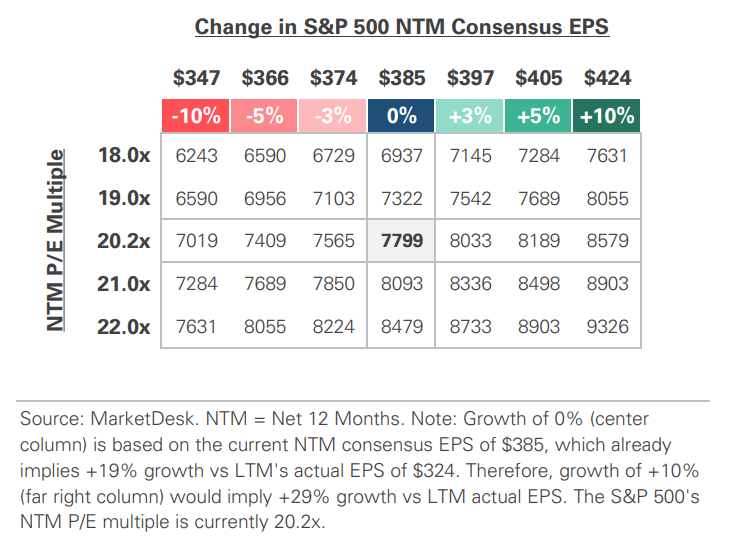
S&P 500 Valuation Matrix
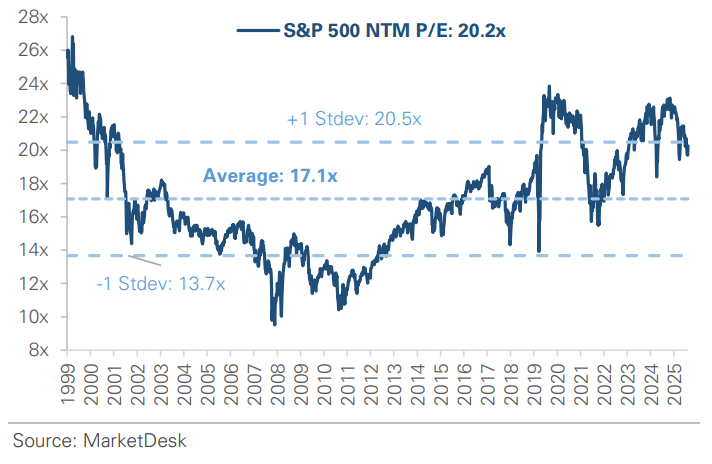
S&P 500 Forward PE Ratio
The S&P 500 forward price-to-earnings (P/E) ratio is a widely followed valuation metric that compares the index's current level to the projected earnings of its constituent companies over the next 12 months. The indicator implies to investors how much they are paying today for each dollar of expected future earnings.
Key Takeaways
#1 - Labor Market Cools Off
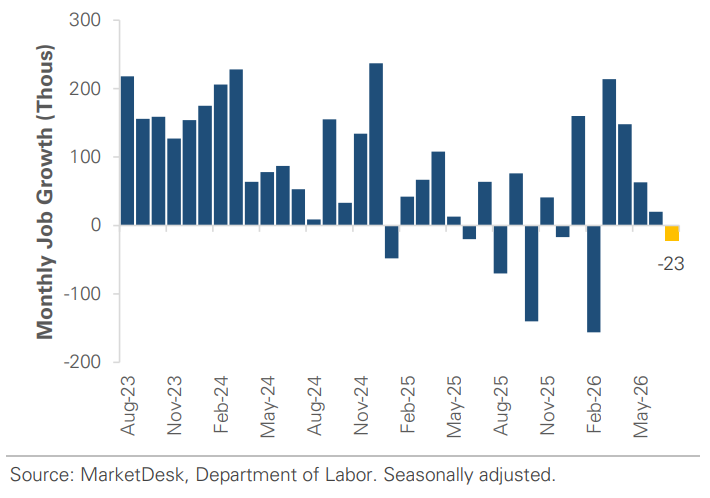
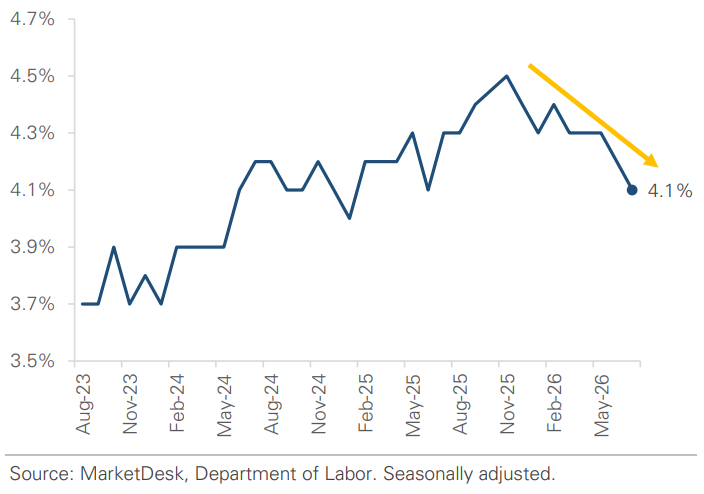
The labor market lost some momentum in July. Employers cut -23,000 jobs last month, while May and June payroll gains were revised lower by a combined -103,000. The negative revisions indicate hiring was weaker than initially reported. However, despite slower job growth, the unemployment rate remained relatively low at 4.1%, and private-sector employment grew +30,000. The report shows a job market that has started to soften, although conditions remain far from the weakness normally associated with a recession.
Implication: The data weakens the argument that interest rates should remain elevated due to labor market conditions.
Monthly Job Growth Turns Negative
Unemployment Declines to 4.1%
#2 - July Inflation Data Eases Uncertainty
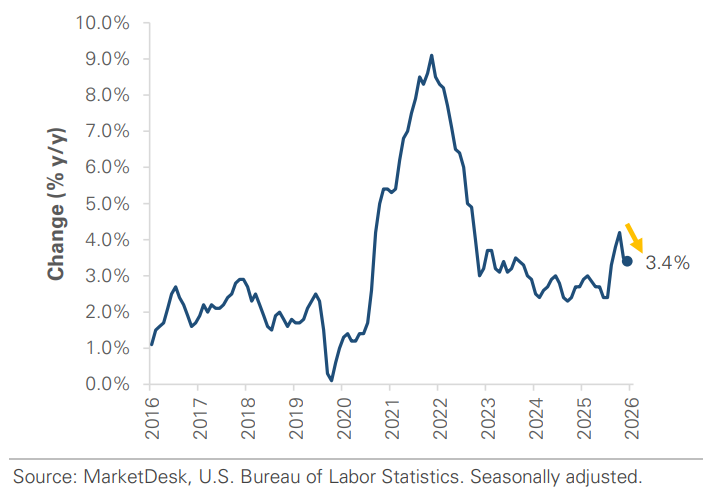
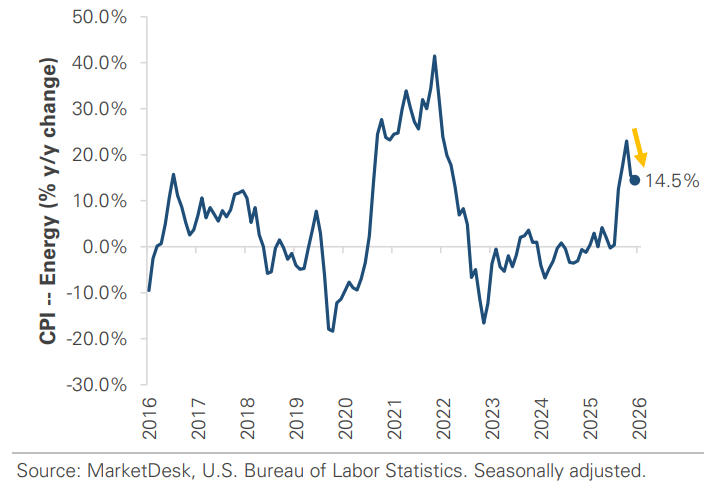
July's inflation data eased some of the uncertainty created by the recent surge in oil prices. Headline consumer prices rose just +0.1% in July, while producer prices were unchanged, coming in below expectations for a modest increase. The energy component within CPI is still 14.5% higher than a year ago, but so far the rise hasn’t translated into a similar increase across broader inflation indexes.
Implication: Inflation remains above the Fed’s target, but July’s data eased concerns that the energy shock is spreading more broadly.
Headline Inflation Declines During July
Energy Inflation Remains Elevated
#3 - Rate Hike Expectations Fall
Expectations for another Fed rate hike have eased as economic data has softened. Heading into last week’s jobs report, markets assigned a greater than 50% probability to a September rate hike, driven by persistent inflation concerns and three dissents at the Fed’s July meeting in favor of higher rates. However, expectations for a September rate hike fell after the weak payroll report, moved lower again after Wednesday’s CPI release, and declined further after Thursday’s flat producer-price report. The shift reflects a different policy backdrop than investors faced several weeks ago: the labor market has softened while the latest inflation data has remained relatively contained, reducing the immediate case for additional tightening.
Implication: With the Fed providing less guidance, incoming economic data points carry more weight. This week's data shifted the balance away from a September hike.
#4 - Demand for AI Computing Power
Demand for the computing power tied to AI remains strong. Companies providing the physical infrastructure needed to run AI models continue to report rapid growth. CoreWeave buys advanced computer chips, installs them in data centers, and leases the computing capacity to customers, including some of the largest tech companies. Its quarterly revenue rose to a record $2.58 billion, while its backlog climbed to $104 billion. Other AI-infrastructure companies reported similarly strong growth this week, reinforcing that demand extends beyond CoreWeave.
Implication: Questions remain about the magnitude of companies’ AI spending, but rapid growth in computing demand signals strong underlying demand for both training and running AI models.
#5 - Small Business Confidence Rises
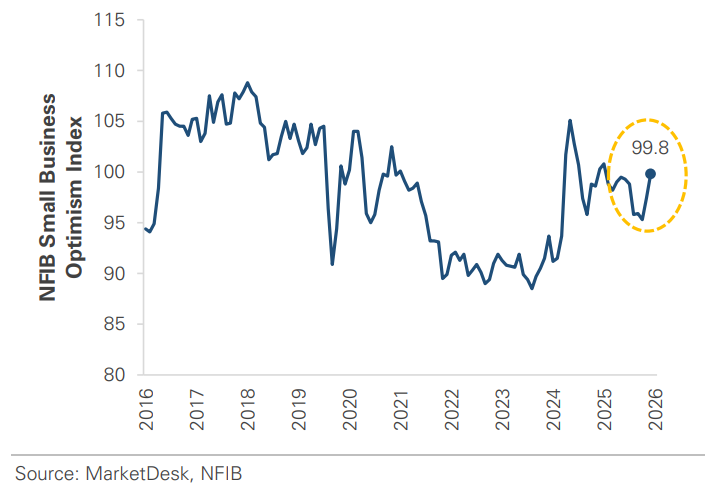
Small-business confidence rose to its highest level in nearly a year. The NFIB Small Business Optimism Index climbed to 99.8 in July, its highest since August 2025 and above its long-term average. Small businesses, which account for nearly half of private-sector employment, have faced several years of elevated inflation, higher borrowing costs, and difficulty finding workers. Those pressures remain, but July’s survey showed improvement across most categories, including a sharp increase in hiring plans.
Implication – Improving sentiment suggests some headwinds facing small businesses are beginning to ease.
Small Business Optimism Rises to a 12-Month High
Important Disclosures
This material is provided for general and educational purposes only and is not investment advice. Your investments should correspond to your financial needs, goals, and risk tolerance. Please consult an investment professional before making any investment or financial decisions or purchasing any financial, securities, or investment-related service or product, including any investment product or service described in these materials.
Our Insights