
Consumers Soften, Interest Rates Rise, and Stocks Trade Lower

Photo Credit: Tem Rysh, Unsplash
Weekly Market Recap for August 21st
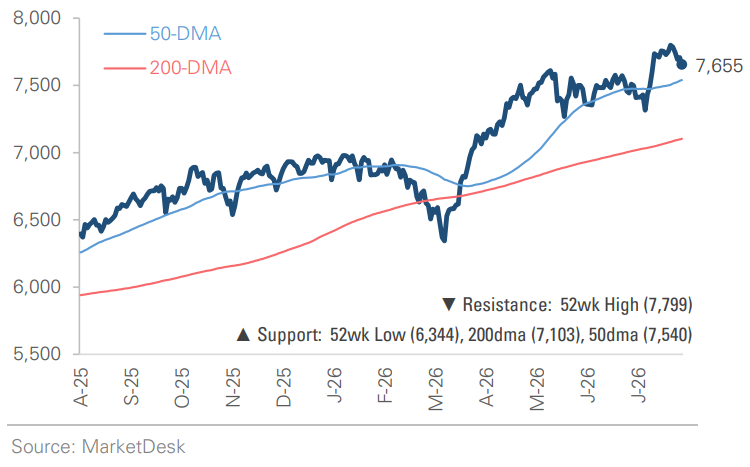
This week, markets traded lower as interest rates continued to rise. The S&P 500 fell -1.9%, the Nasdaq declined -3.1%, and the Russell 2000 small-cap index returned -2.0%. Value (-0.6%) outpaced Growth (-3.2%) as high-valuation tech stocks sold off the most, while the equal-weight S&P 500 fell -0.9%. Energy led all sectors with a gain of nearly +5%, followed by Health Care at +3%. Technology was the worst-performing sector with a -4.2% return, followed by Industrials (-3.3%). Bonds traded lower as Treasury yields rose, with longer-maturity Treasuries down roughly 0.3%. Corporate bonds underperformed Treasuries as corporate credit spreads widened. The U.S. dollar weakened -1.1%, the VIX drifted higher, and Bitcoin gained more than +14%.
S&P 500 Index (Last 12 Months)
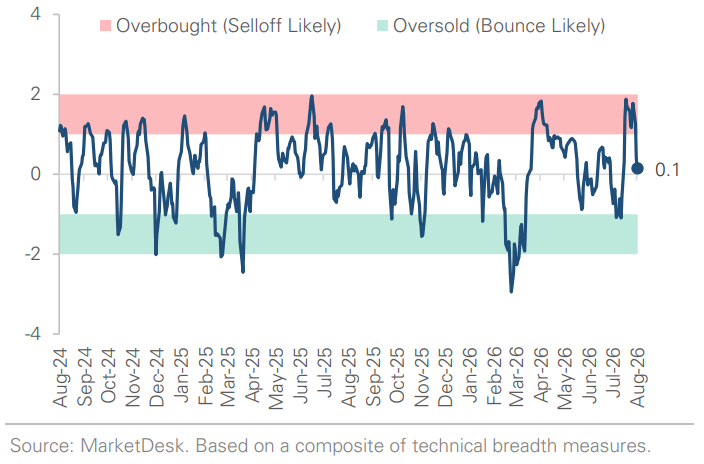
S&P 500 Technical Composite (Last 24 Months)
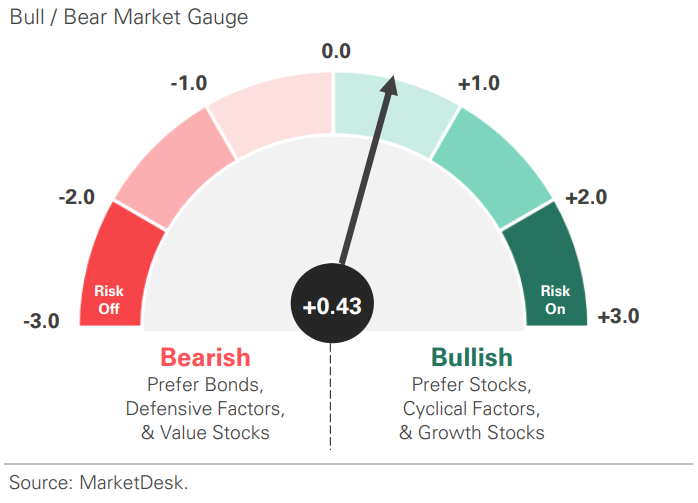
US Risk Demand Market Indicator
The US Risk Demand Indicator (USRDI) is a quantitative tool to measure real-time investor risk appetite. When the indicator is above zero, it signals a risk-on environment favoring cyclical sectors, high-beta stocks, high-yield corporate bonds, and hybrid (convertible) bonds. In contrast, a reading below zero signals a risk-off environment favoring defensive sectors, low-volatility stocks, and US Treasury bonds.
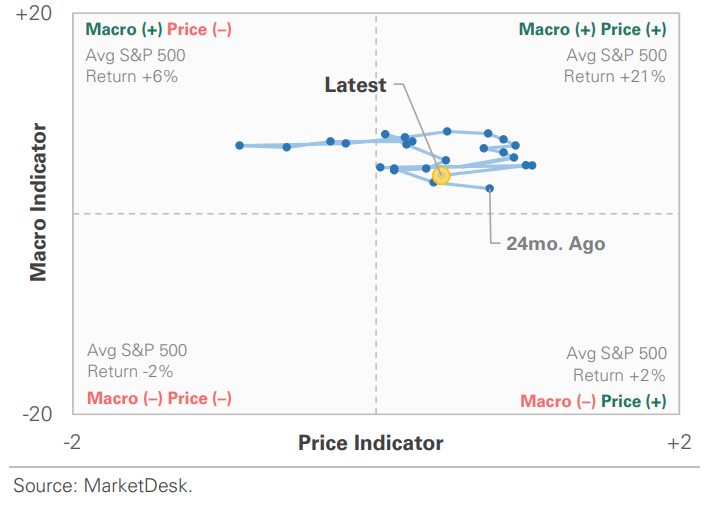
US Market Economic Cycle Indicator
The Market Cycle Indicator tracks two primary investor groups: macro investors and price-based investors. Macro investors rely on fundamental and economic data to guide their decisions, while price-based investors (or technical analysts) focus on price action, momentum, volume, and behavioral trends. The Indicator synthesizes these perspectives to identify the prevailing market regime.
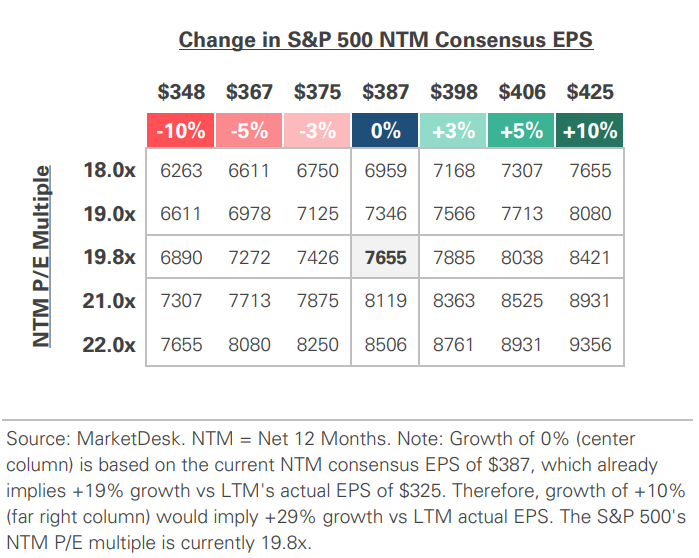
S&P 500 Valuation Matrix
S&P 500 Forward PE Ratio
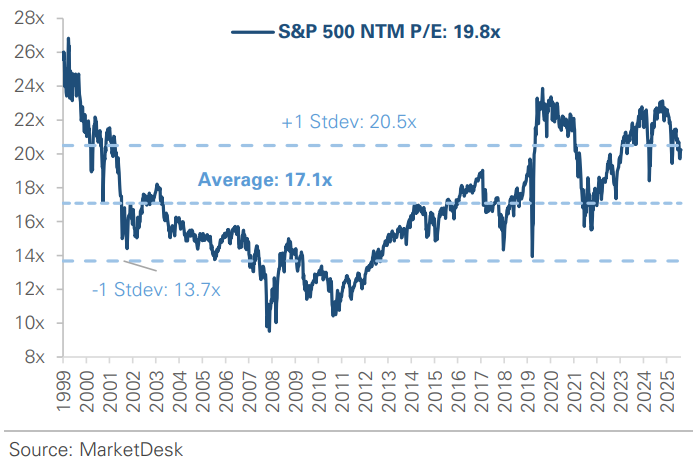
The S&P 500 forward price-to-earnings (P/E) ratio is a widely followed valuation metric that compares the index's current level to the projected earnings of its constituent companies over the next 12 months. The indicator implies to investors how much they are paying today for each dollar of expected future earnings.
Key Takeaways
#1 - Consumer Spending Slows
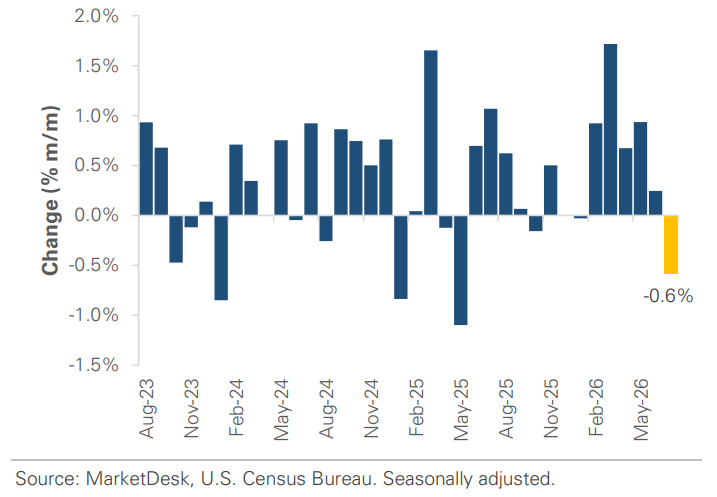
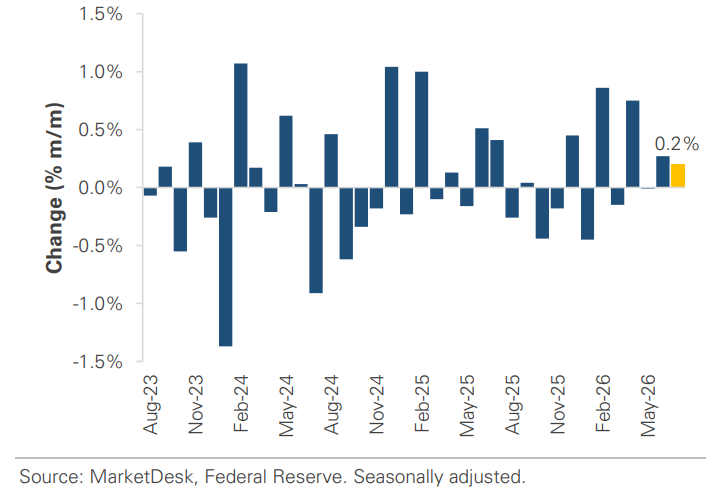
Consumer spending showed further signs of softening in July. Retail and food-service sales fell -0.6% month-over-month after rising just +0.2% in June. Unlike in June, July’s weakness was broader than gasoline alone, with sales excluding autos and gasoline declining -0.2%. A portion of July’s decline likely reflected the timing of Amazon’s Prime Day sales event in late June, which may have pulled online purchases forward. Despite the slowdown, consumers continue to spend. Total retail sales were +5.0% above a year ago, while restaurants and several store categories posted gains.
Implication: The past two months suggest consumers are still spending, but at a more moderate pace than earlier in the year.
Consumer Spending Unexpectedly Slows
#2 - Consumers Concerned About Inflation
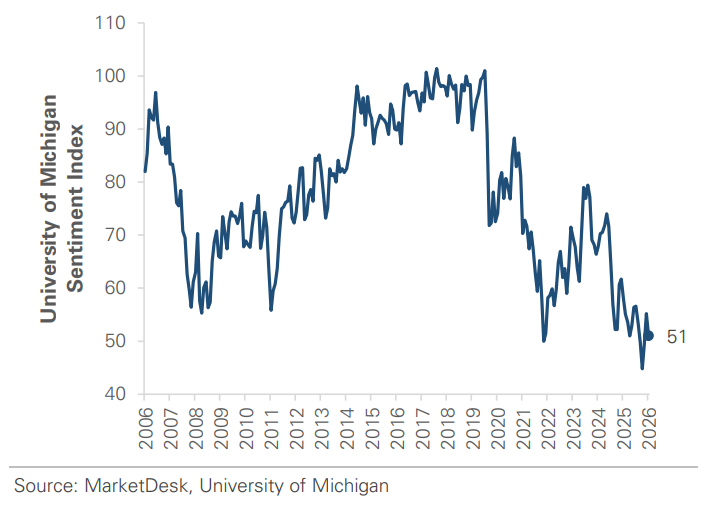
Consumer confidence also weakened in early August amid continued inflation concerns. The University of Michigan’s sentiment index fell to 51.0 from 55.2 in July, reversing two months of improvement. Only 8% of consumers said they expected their income growth to outpace inflation over the next year, down from 18% in December, as higher prices, including energy costs, continued to weigh on purchasing power.
Implication: Sentiment does not always translate directly into spending, but weaker confidence and persistent concerns about purchasing power suggest the consumer may be softening.
Consumer Sentiment Remains Weak
#3 - Oil Prices Complicate Rate Outlook
Higher oil prices and a cautious Federal Reserve are complicating the interest-rate outlook. Oil prices moved higher again this week as tensions around the Strait of Hormuz raised concerns about energy supply. Higher energy costs can pressure consumer purchasing power and add to inflation, complicating the Federal Reserve’s policy outlook. Minutes from the Fed’s July meeting showed policymakers remain concerned about inflation, with some officials open to additional tightening if price pressures do not improve.
Implication: Softer consumer data would normally strengthen the case for lower interest rates, but higher energy prices and persistent inflation could limit how quickly the Fed can respond.
Industrial Production Continues to Expand
#4 - Treasury Yields Defy Growth Trends
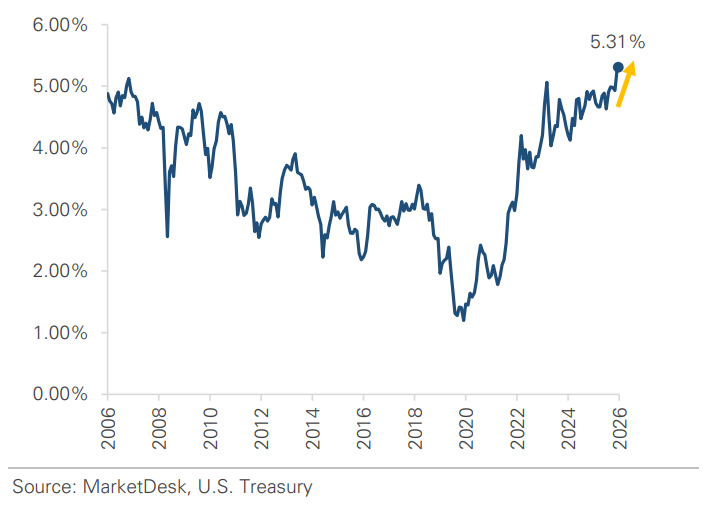
The 30-year Treasury yield climbed above 5.30% this week, its highest level since 2007, even as retail sales and consumer sentiment weakened. Softer growth would typically increase demand for Treasuries and push yields lower. However, inflation concerns and heavy government borrowing continue to put upward pressure on long-term rates.
Implication: If this relationship persists, longer-maturity Treasury bonds may not provide the same degree of portfolio protection they have historically offered during periods of weaker growth.
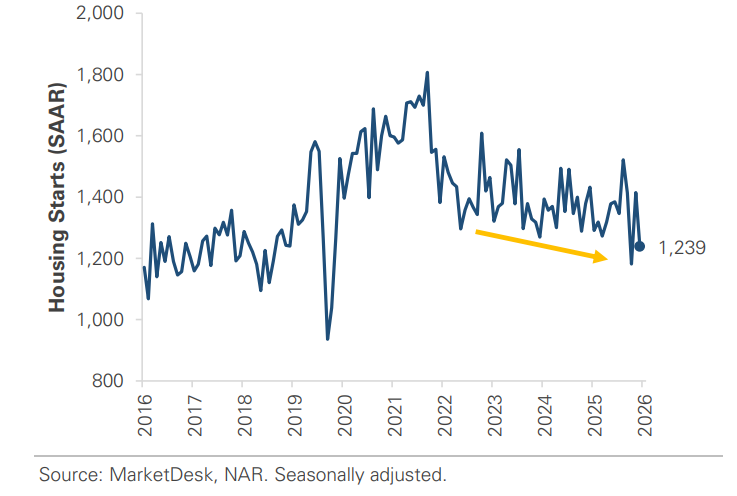
Housing Starts Continue to Slow
#5 - Stocks Digest: Rise In Long-Term Interest Rates
Rising Treasury yields created a challenging backdrop for equities this week, particularly for market segments that trade at higher valuations. Higher bond yields give investors a more attractive alternative to stocks, which can put downward pressure on equity valuations as stocks compete with higher-yielding bonds. Stocks have remained relatively resilient despite the rise in interest rates, but the rate move has contributed to increased volatility.
Implication – Higher interest rates can be a potential headwind for equities. However, rates are only one factor influencing market direction, with earnings growth and the economy also impacting forward returns.
30-Year Treasury Yield Continues to Rise
Important Disclosures
This material is provided for general and educational purposes only and is not investment advice. Your investments should correspond to your financial needs, goals, and risk tolerance. Please consult an investment professional before making any investment or financial decisions or purchasing any financial, securities, or investment-related service or product, including any investment product or service described in these materials.
Our Insights