
Photo Credit: Look Again Digital
Weekly Market Recap for October 30th
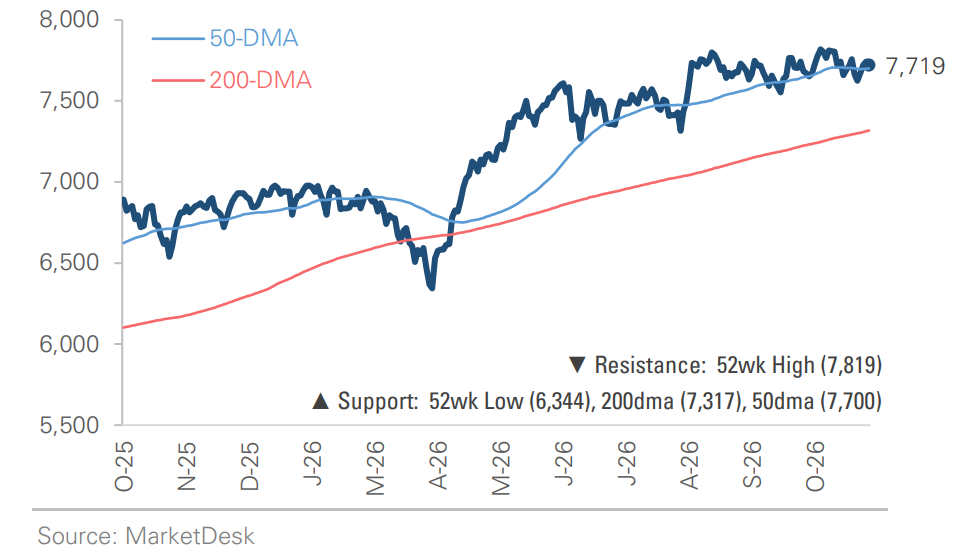
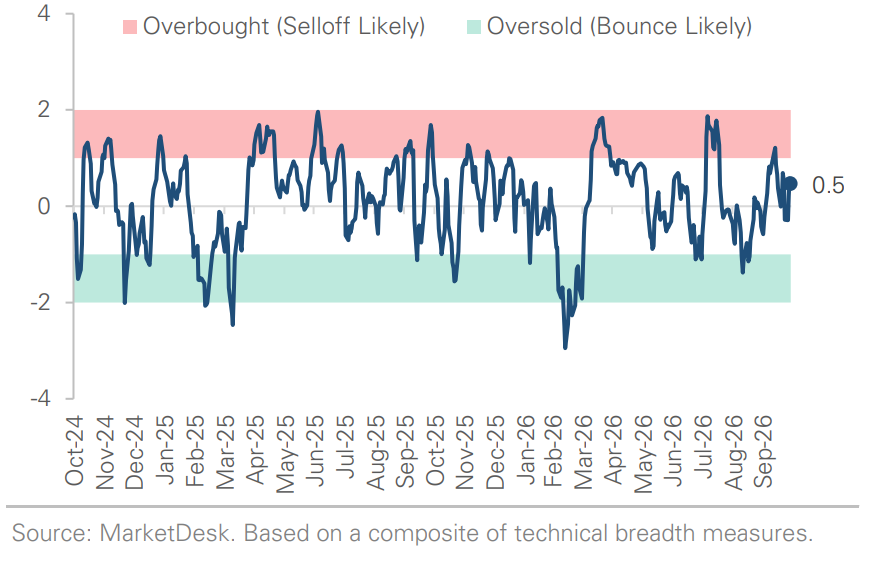
Stocks were mixed as investors weighed a Fed decision, strong economic data, and earnings from the largest tech companies. The S&P 500 drifted higher, and the Nasdaq gained nearly +1.5%, while the Dow Jones fell about -1%. The small-cap factor outperformed, with the Russell 2000 rising nearly +2.5%. Overall, 9 of 11 sectors traded higher. Tech led all sectors with a +3.1% gain, while Communication Services fell over -5% after Alphabet's earnings disappointed. High Beta and Momentum stocks outperformed Low Volatility, reversing part of last week's shift toward defensive stocks. Treasury yields edged higher, with the 10-year yield remaining near 5%. Oil swung after attacks on Saudi energy facilities and ended the week nearly +3% higher, while the U.S. dollar firmed and the VIX, a measure of expected volatility, fell back below 20.
S&P 500 Index (Last 12 Months)
S&P 500 Technical Composite (Last 24 Months)
US Risk Demand Market Indicator
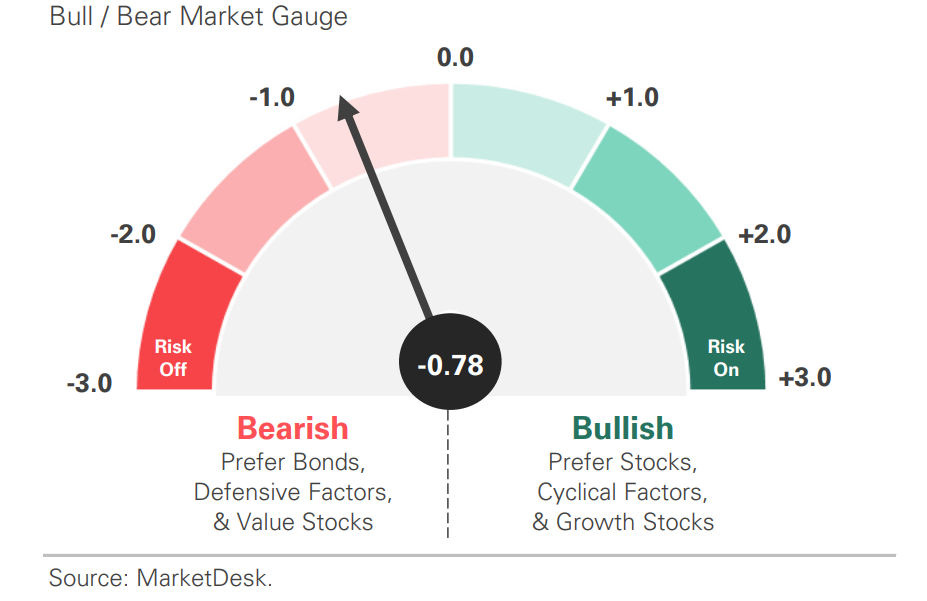
The US Risk Demand Indicator (USRDI) is a quantitative tool to measure real-time investor risk appetite. When the indicator is above zero, it signals a risk-on environment favoring cyclical sectors, high-beta stocks, high-yield corporate bonds, and hybrid (convertible) bonds. In contrast, a reading below zero signals a risk-off environment favoring defensive sectors, low-volatility stocks, and US Treasury bonds.
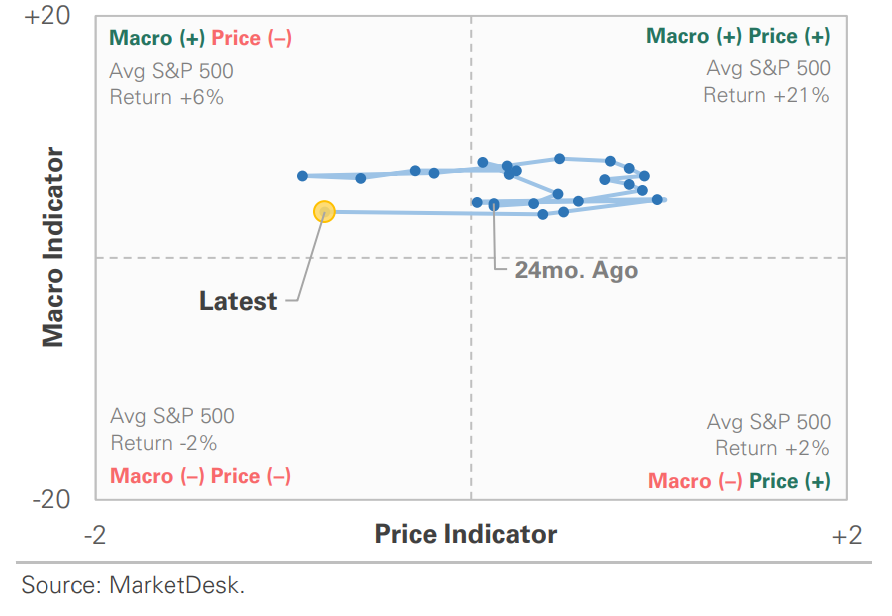
US Market Economic Cycle Indicator
The Market Cycle Indicator tracks two primary investor groups: macro investors and price-based investors. Macro investors rely on fundamental and economic data to guide their decisions, while price-based investors (or technical analysts) focus on price action, momentum, volume, and behavioral trends. The Indicator synthesizes these perspectives to identify the prevailing market regime.
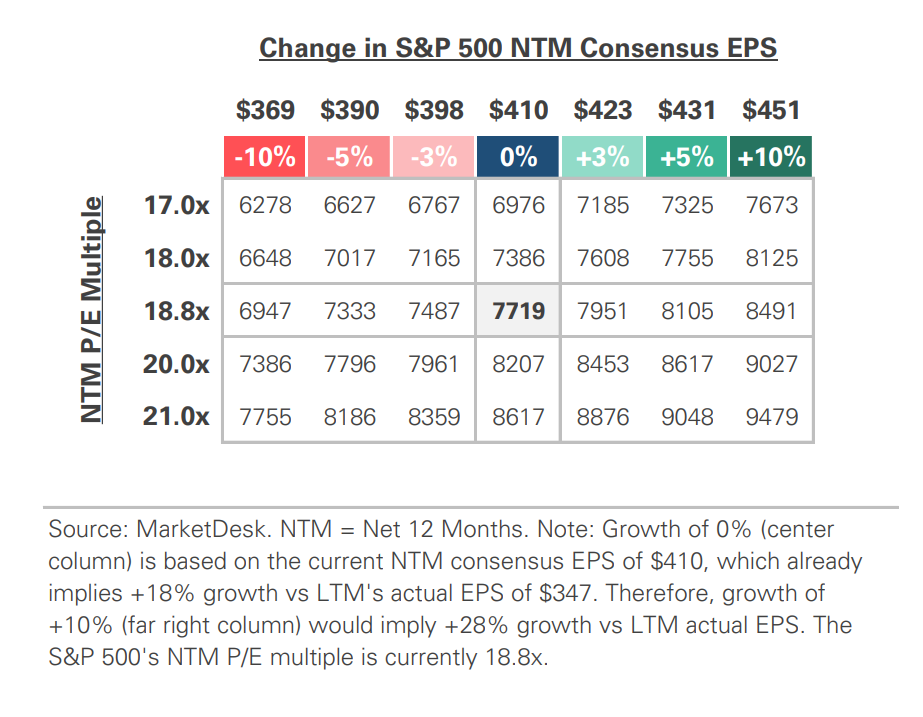
S&P 500 Valuation Matrix
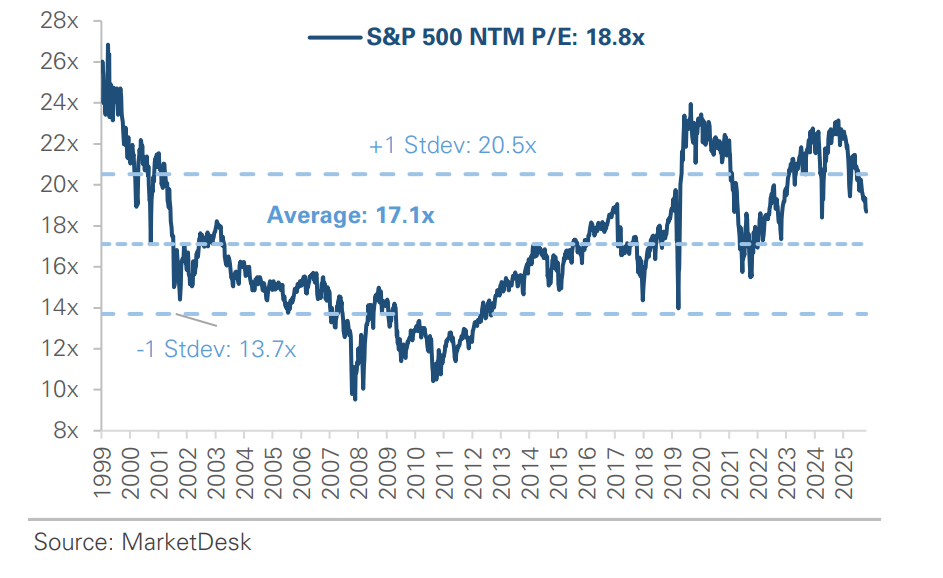
S&P 500 Forward PE Ratio
The S&P 500 forward price-to-earnings (P/E) ratio is a widely followed valuation metric that compares the index's current level to the projected earnings of its constituent companies over the next 12 months. The indicator implies to investors how much they are paying today for each dollar of expected future earnings.
Key Takeaways
#1 - Consumers and AI Investment Lift Growth
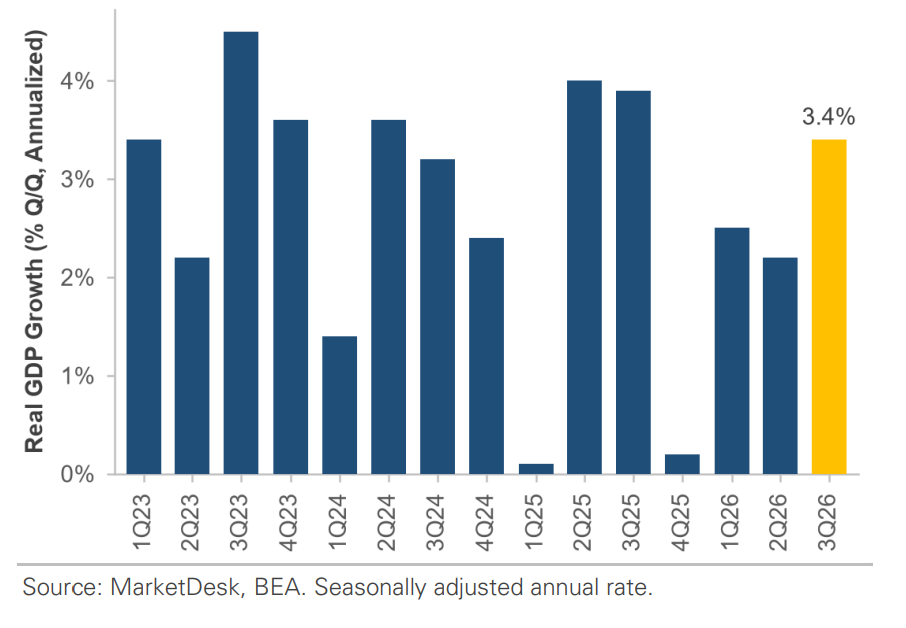
Real GDP grew at a +3.4% annualized rate, above the roughly +3.2% economists expected and up from +2.2% in the second quarter. Consumer spending grew +3.8%, matching the prior quarter’s pace, led by spending on health care and restaurants. Investment in information processing equipment, which includes the computers and servers used in AI data centers, rose +37.4%, while residential investment declined as high mortgage rates weighed on housing. Real final sales to private domestic purchasers, which exclude volatile categories like trade, inventories, and government spending, grew +4.9%.
Implication – Underlying private demand grew faster than the headline, with the quarter’s strength coming from households and businesses rather than temporary swings in trade or inventories
U.S. Growth Accelerates to 3.4%
#2 - Inflation Rises, Real Spending Stalls
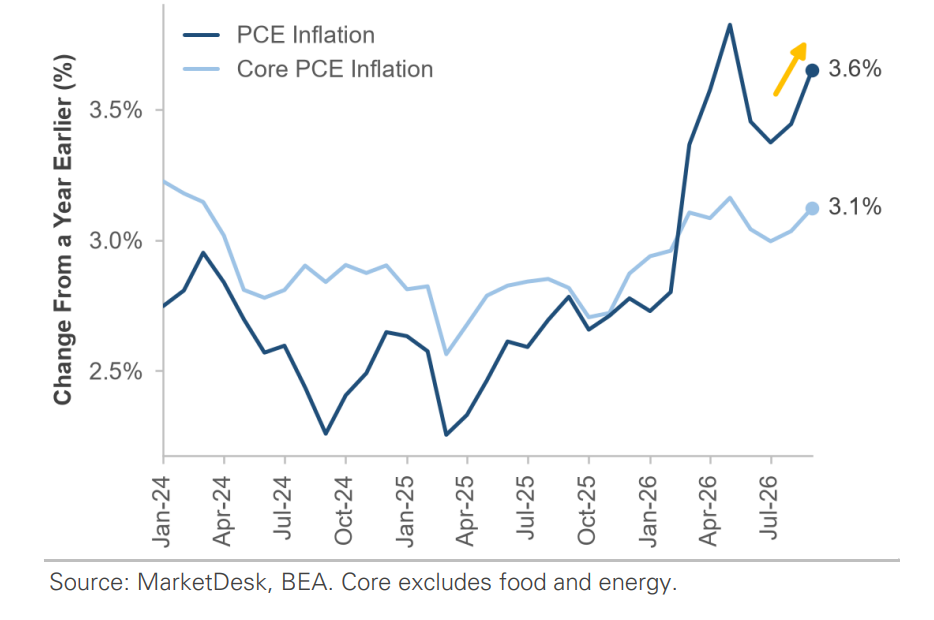
The PCE price index, the Fed's preferred inflation measure, rose +3.6% from a year earlier, up from +3.4% in August, while core PCE inflation, which excludes food and energy, rose to +3.1%. Consumer spending increased +0.5% for the month but was essentially flat after adjusting for inflation. Real disposable income fell -0.3%, and the personal saving rate dropped to 3.8%, its lowest level since 2022, as households saved less to keep spending.
Implication – The strong quarter ended on a softer note, with rising prices absorbing the gains in household spending and leaving consumers with a thinner savings cushion
Higher Prices Erase September’s Spending Gains
#3 - Fed Holds, Hike Risk Builds
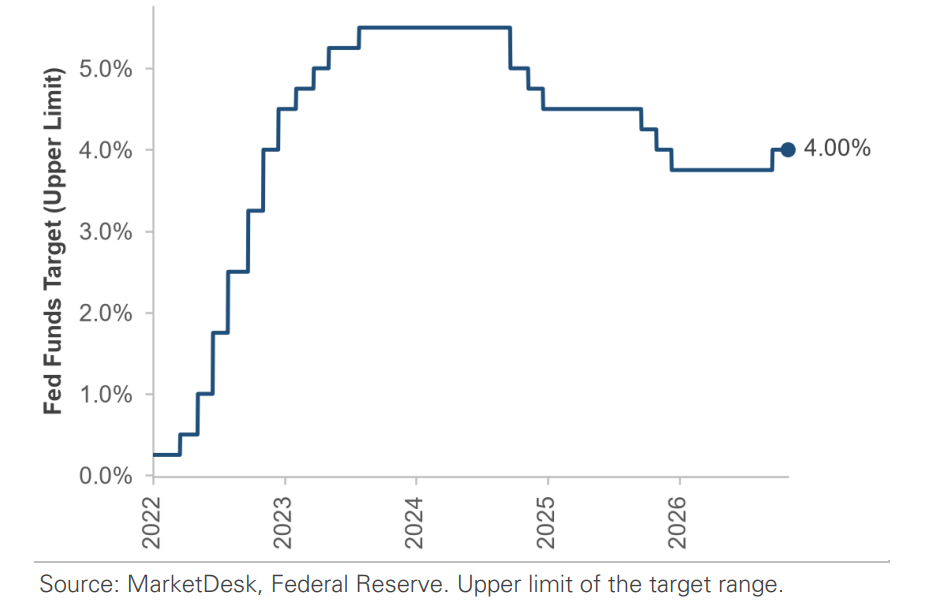
The Fed kept its target range at 3.75%-4.00% after raising rates in September, but two members dissented in favor of a quarter-point increase. The Fed's statement said economic activity is "expanding at a strong pace" and inflation "remains elevated," while Chair Kevin Warsh declined to signal the next move. Markets raised the odds of a December hike to about 80%, according to CME FedWatch. Longer-term Treasury yields initially rose after the decision, with the 10-year yield closing above 5% on Wednesday.
Implication – The dissents show that support for further tightening extends beyond a single official, which is why markets now treat a December hike as the most likely outcome.
Fed Pauses as Markets Price In a December Hike
#4 - AI Investors Favor Cash Generators
Alphabet shares fell more than -10% on Thursday after the company reported a second consecutive quarter of negative free cash flow, with quarterly capital spending of more than $51 billion outpacing the cash its business generated. In contrast, Microsoft reported +48% growth in its Azure cloud business and positive free cash flow, and its shares held up far better. Earlier in the week, Oracle jumped more than +10% after capping how much new capital it plans to raise. Meanwhile, AI financing continues to grow: Meta launched a stock sale of up to $95 billion to fund new data centers, AI developer Anthropic filed to go public, and Microsoft announced plans to issue $25 billion of debt.
Implication – After weeks of focus on how the AI buildout is financed, investors are rewarding the companies that can pay for it from their own cash flow
Important Disclosures
This material is provided for general and educational purposes only and is not investment advice. Your investments should correspond to your financial needs, goals, and risk tolerance. Please consult an investment professional before making any investment or financial decisions or purchasing any financial, securities, or investment-related service or product, including any investment product or service described in these materials.
Our Insights