
Photo Credit: Spencer Demera
Weekly Market Recap for November 6th
Major indexes fell as a selloff in semiconductor and other AI-related stocks outweighed a broad rally the day after the midterm elections. The S&P 500 fell -4.7% and the Nasdaq dropped -9.5%, while the Dow Jones fell -1.6% and the Russell 2000 small-cap index fell -4.5%. The Equal-Weight S&P 500 fell a more modest -1.4%, and Value outperformed Growth by a wide margin as Momentum and High Beta stocks fell -16.2% and -13.5%, respectively. Overall, 7 of 11 sectors traded higher, led by Consumer Staples, which gained +3.6%, while Tech fell -14.0%. Treasuries rallied as the 10-year yield fell to its lowest level since September. Oil fell -11.1% on hopes of a diplomatic resolution in the Middle East, gold rebounded above $4,000, and the VIX, a measure of expected volatility, jumped above 25.
S&P 500 Index (Last 12 Months)
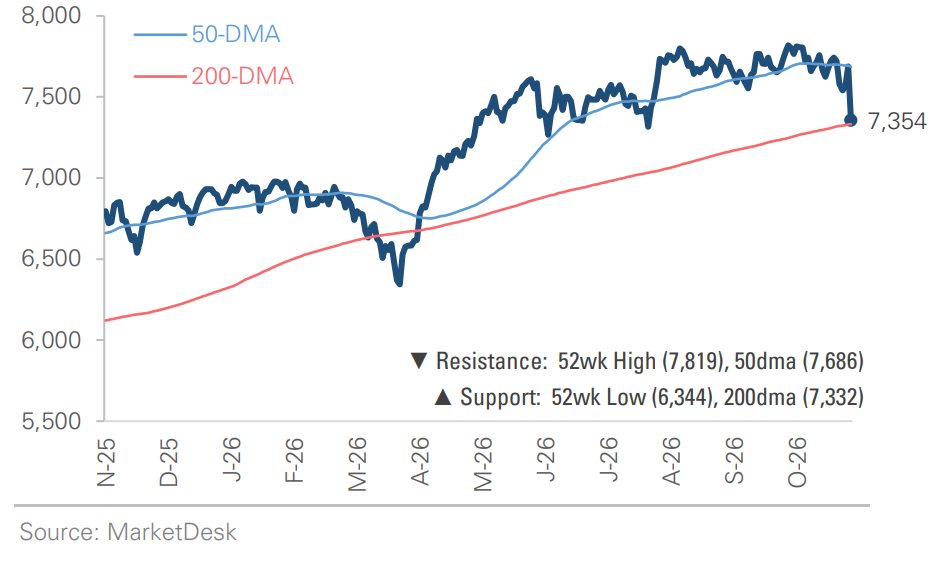
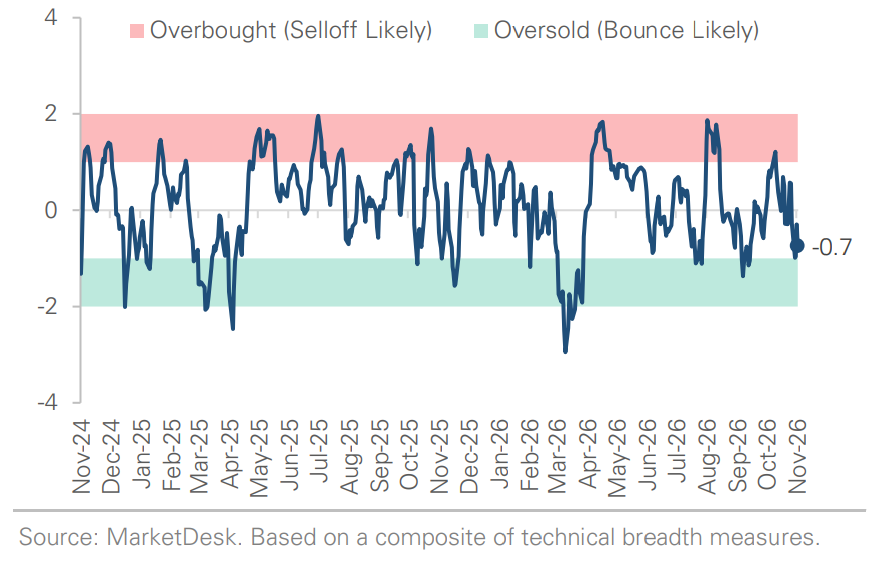
S&P 500 Technical Composite (Last 24 Months)
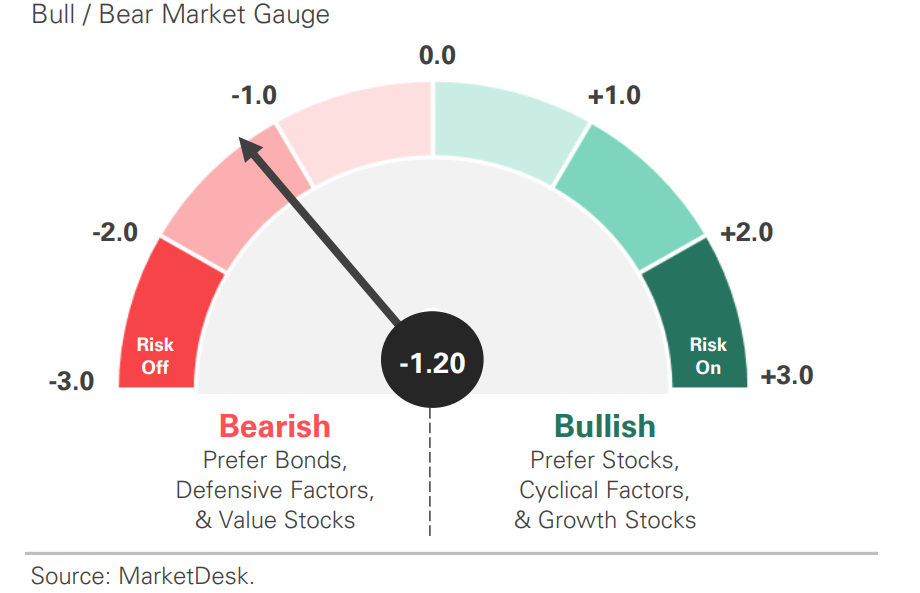
US Risk Demand Market Indicator
The US Risk Demand Indicator (USRDI) is a quantitative tool to measure real-time investor risk appetite. When the indicator is above zero, it signals a risk-on environment favoring cyclical sectors, high-beta stocks, high-yield corporate bonds, and hybrid (convertible) bonds. In contrast, a reading below zero signals a risk-off environment favoring defensive sectors, low-volatility stocks, and US Treasury bonds.
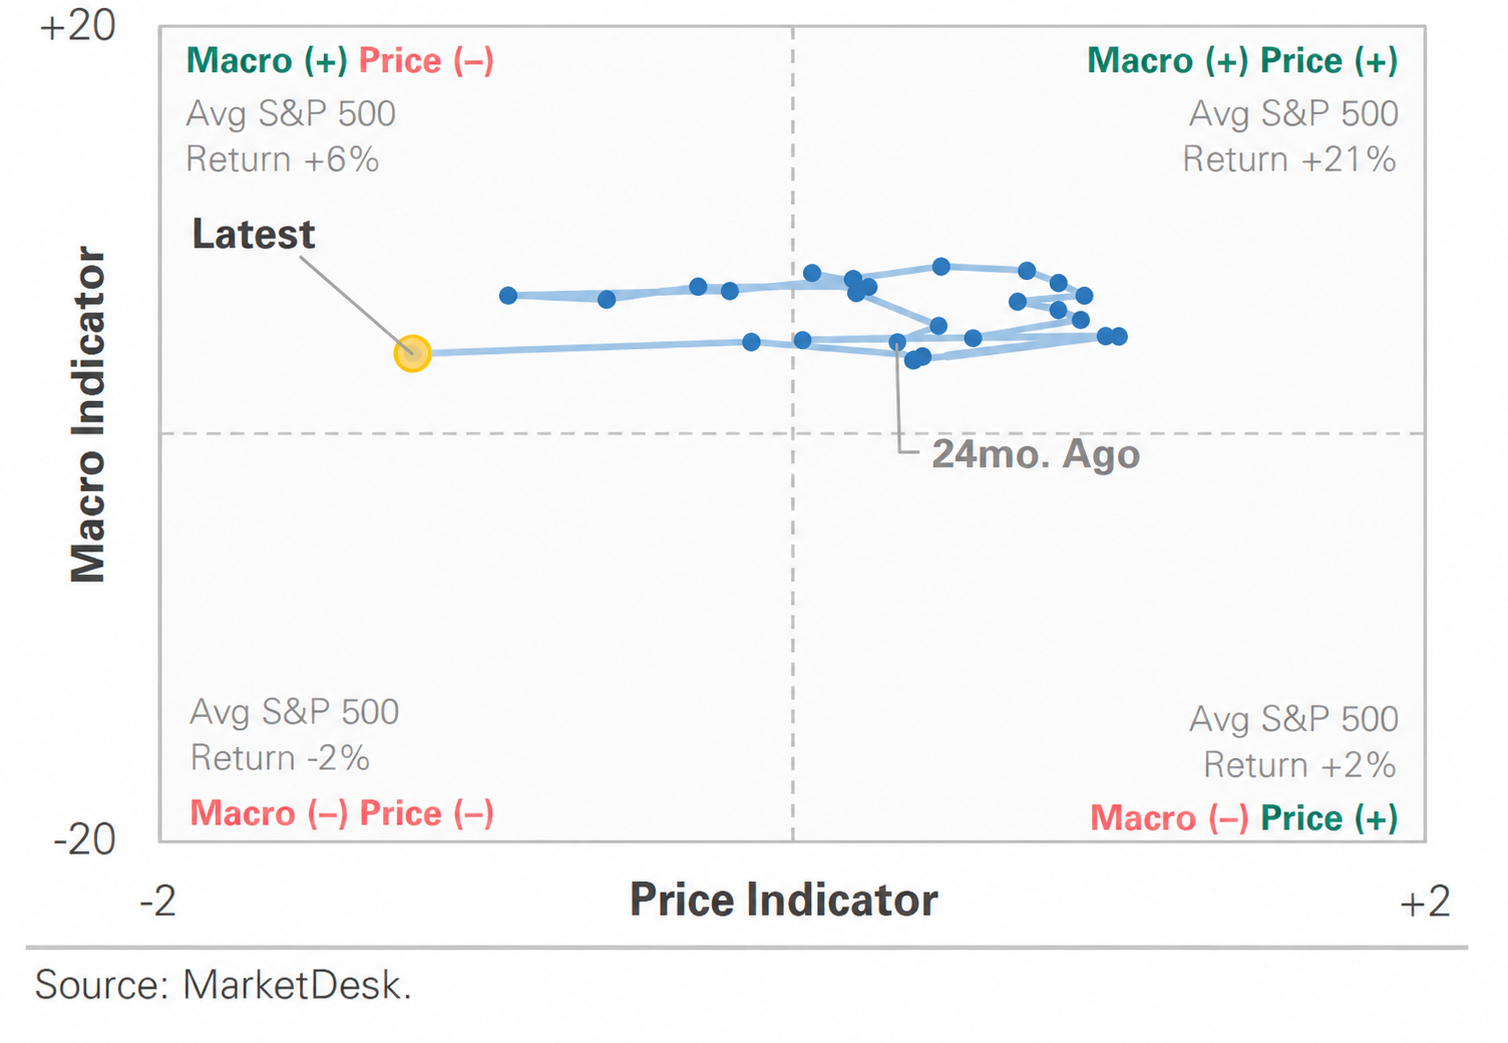
US Market Economic Cycle Indicator
The Market Cycle Indicator tracks two primary investor groups: macro investors and price-based investors. Macro investors rely on fundamental and economic data to guide their decisions, while price-based investors (or technical analysts) focus on price action, momentum, volume, and behavioral trends. The Indicator synthesizes these perspectives to identify the prevailing market regime.
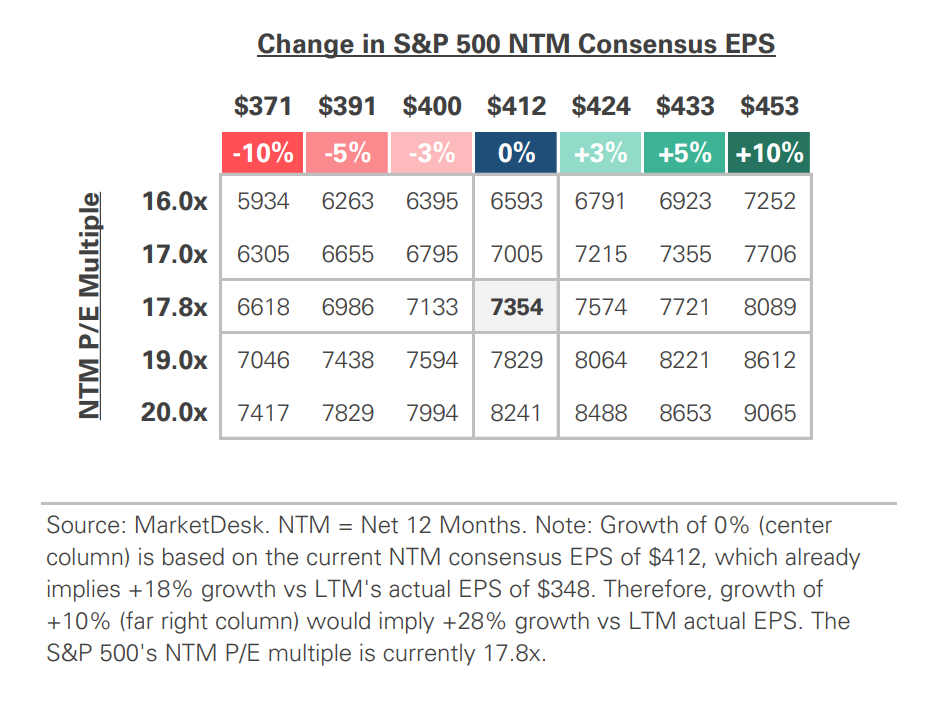
S&P 500 Valuation Matrix
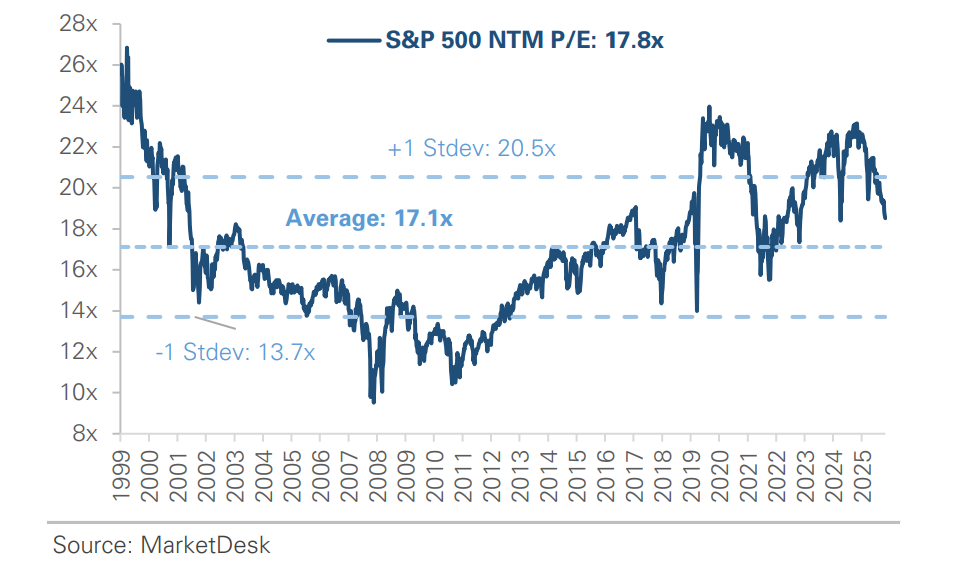
S&P 500 Forward PE Ratio
The S&P 500 forward price-to-earnings (P/E) ratio is a widely followed valuation metric that compares the index's current level to the projected earnings of its constituent companies over the next 12 months. The indicator implies to investors how much they are paying today for each dollar of expected future earnings.
Key Takeaways
#1 - Divided Government, Brief Relief
Democrats won majorities in both the House and Senate, which means major legislation will need support from both parties during the final two years of President Trump’s term. Markets initially welcomed the outcome, with the S&P 500 gaining +1.6% on Wednesday as election uncertainty eased and investors anticipated fewer major policy changes. Treasury yields declined, reflecting expectations of more constrained fiscal spending, although falling oil prices also contributed. Policy uncertainty did not disappear, however: as discussed below, tech stocks weakened amid concerns about potentially tighter AI regulation.
Implication – Divided government makes major legislative changes more difficult. Attention now turns to deadlines that require bipartisan agreement, such as the 2027 debt limit, while the White House can still act on trade through executive action.
Beyond Tech, Stocks Hold Their Ground
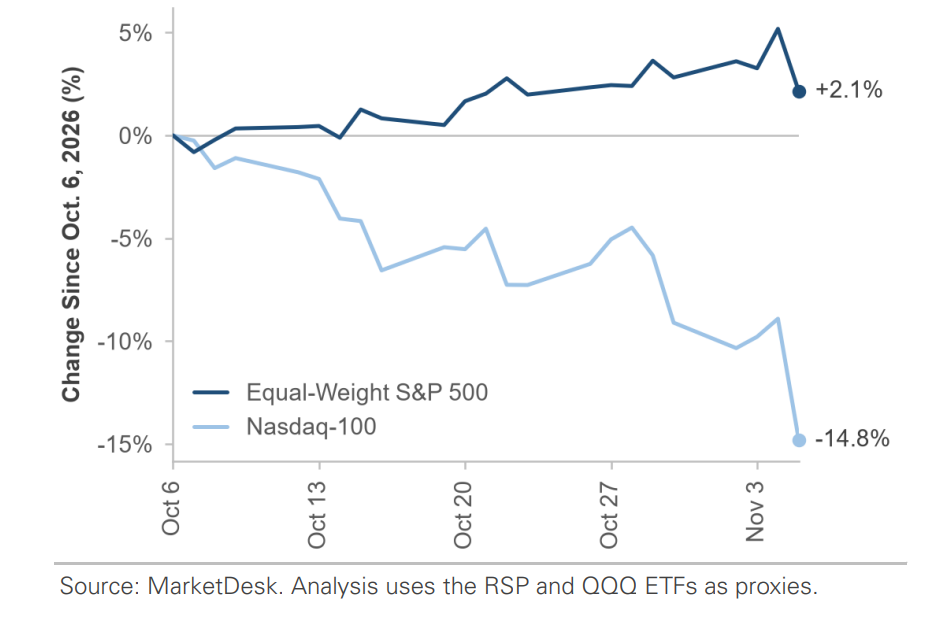
#2 - AI’s Buildout Hits Resistance
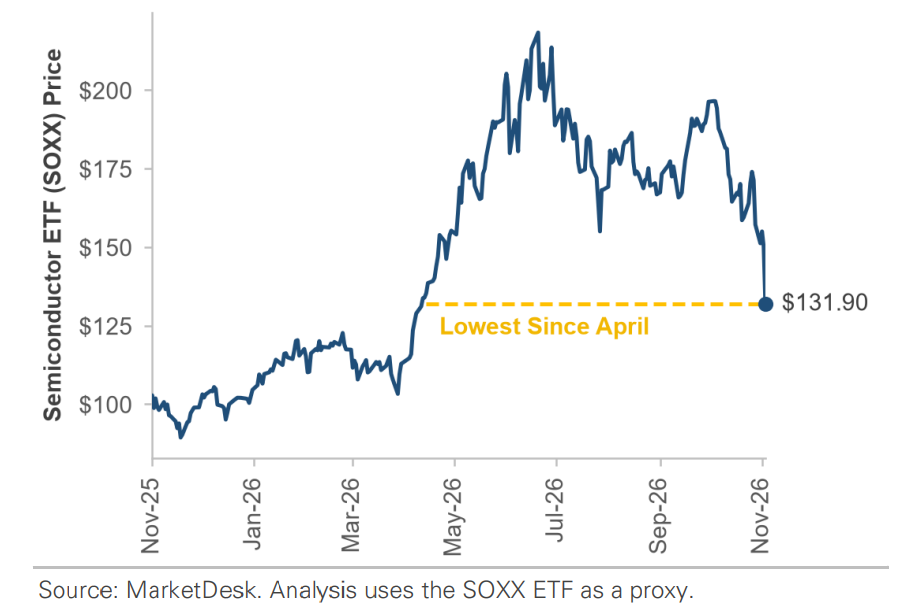
The pressure started last Friday, when Intel fell about - 29%, its worst day since 1974, after a weak outlook. The selling spread across chipmakers, and it continued this week despite strong earnings results from AMD, a chipmaker whose data-center revenue nearly doubled from a year ago. Tuesday's midterm elections, in which voters approved local ballot measures that restrict data-center construction, added pressure as investors weighed the prospect of tighter AI regulation and delays to planned data-center projects. An index of semiconductor companies fell more than -12% on Thursday and closed at its lowest level since April of this year.
Implication – The debate over AI has broadened from whether the spending will pay off to whether the buildout can continue at its planned pace, a question that can’t be settled simply by strong earnings results.
Chip Stocks Slide as AI Risks Mount
#3 - Oil Slides on Deal Hopes on the Strait of Hormuz
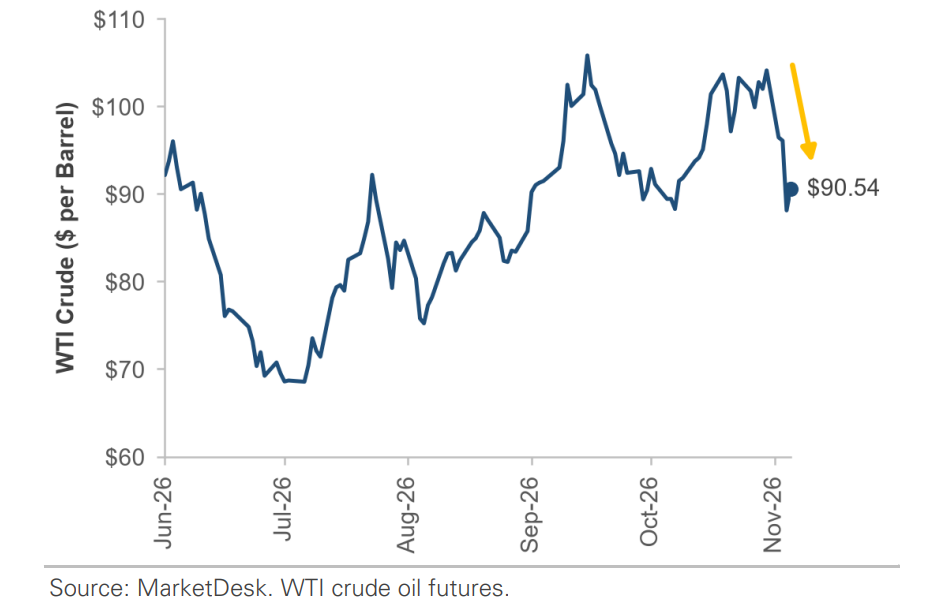
Under a plan drafted with Qatari mediators, Iran said it could reopen the strait within two days of a deal if the U.S. meets Iran’s conditions, including lifting sanctions. The U.S. hasn’t accepted the terms, but oil prices fell as traders priced in the probability of a negotiated settlement. West Texas Intermediate crude fell -11.1% for the week, and Brent, the international benchmark, fell below $100 after hitting a six-month high last Friday.
Implication – Lower oil prices ease one of the main sources of this year’s inflation pressure, and the decline helped pull Treasury yields lower.
Oil Retreats on Reopening Hopes
#4 - Strong Data Keeps Rate Hikes in Play
Alphabet shares fell more than -10% on Thursday after the company reported a second consecutive quarter of negative free cash flow, with quarterly capital spending of more than $51 billion outpacing the cash its business generated. In contrast, Microsoft reported +48% growth in its Azure cloud business and positive free cash flow, and its shares held up far better. Earlier in the week, Oracle jumped more than +10% after capping how much new capital it plans to raise. Meanwhile, AI financing continues to grow: Meta launched a stock sale of up to $95 billion to fund new data centers, AI developer Anthropic filed to go public, and Microsoft announced plans to issue $25 billion of debt.
Implication – After weeks of focus on how the AI buildout is financed, investors are rewarding the companies that can pay for it from their own cash flow
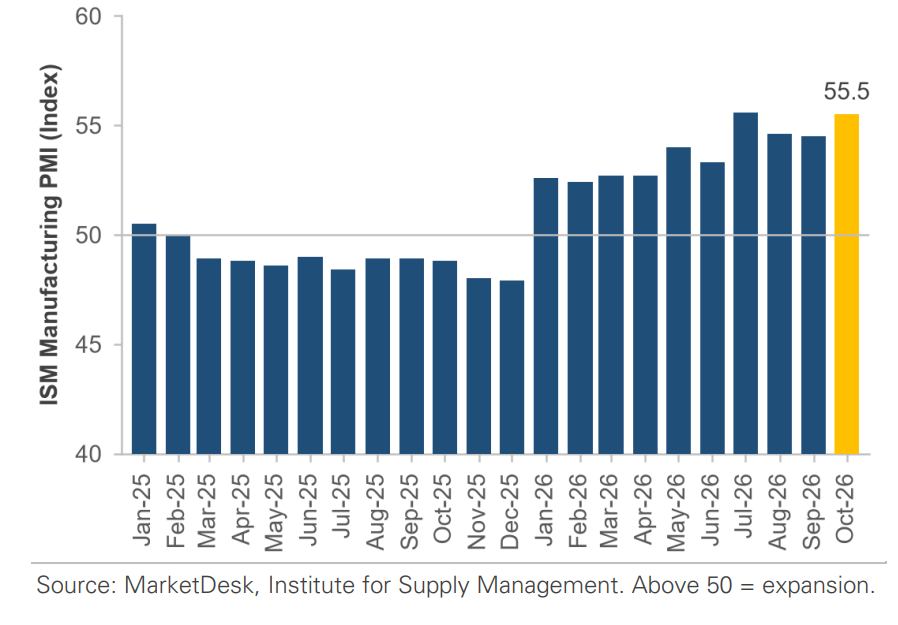
Manufacturing Gains Momentum
Important Disclosures
This material is provided for general and educational purposes only and is not investment advice. Your investments should correspond to your financial needs, goals, and risk tolerance. Please consult an investment professional before making any investment or financial decisions or purchasing any financial, securities, or investment-related service or product, including any investment product or service described in these materials.
Our Insights