
Photo Credit: Getty Images
Weekly Market Recap for November 13th
Markets rebounded from last week’s selloff as semiconductor stocks rallied, even as Treasury yields rose on hot jobs and inflation data. The S&P 500 rose more than +3%, the Nasdaq gained over +6%, the Dow Jones rose about +2%, and the Russell 2000 small-cap index rose nearly +3%. The Equal-Weight S&P 500 rose nearly +2%, and Growth outperformed Value as Momentum and High Beta stocks rebounded about +11% and +9%, respectively. Ten of the 11 sectors traded higher, led by Tech (+7%), while Consumer Staples was flat. Treasuries fell as the 2-year yield jumped on expectations of Fed rate hikes, and the U.S. dollar rose to its highest close since April 2025. Oil fell about -2% despite a late-week rebound, gold dropped back below $4,000, and the VIX fell below 20 after spiking above 25 last week.
S&P 500 Index (Last 12 Months)
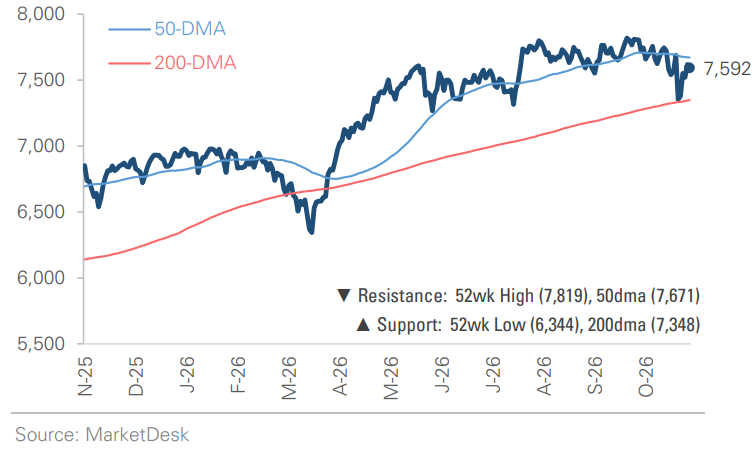
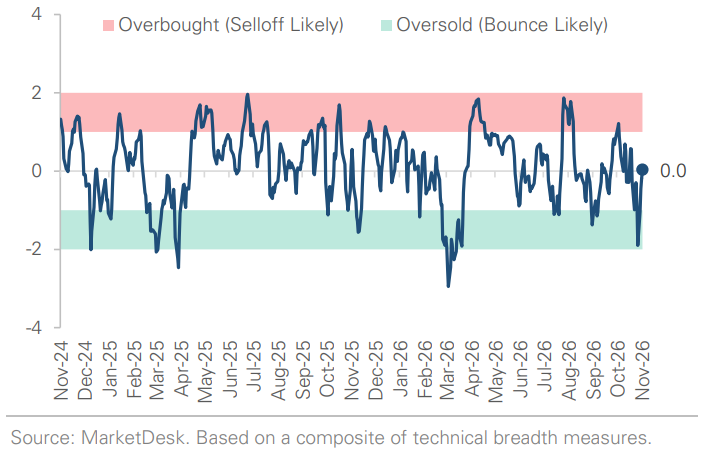
S&P 500 Technical Composite (Last 24 Months)
US Risk Demand Market Indicator
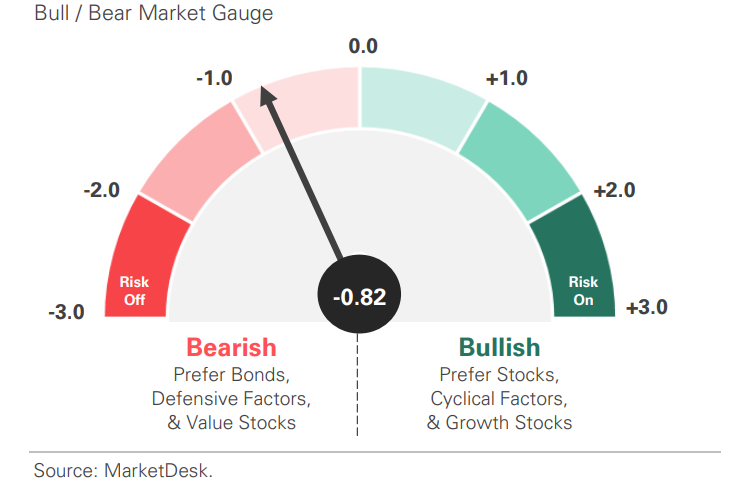
The US Risk Demand Indicator (USRDI) is a quantitative tool to measure real-time investor risk appetite. When the indicator is above zero, it signals a risk-on environment favoring cyclical sectors, high-beta stocks, high-yield corporate bonds, and hybrid (convertible) bonds. In contrast, a reading below zero signals a risk-off environment favoring defensive sectors, low-volatility stocks, and US Treasury bonds.
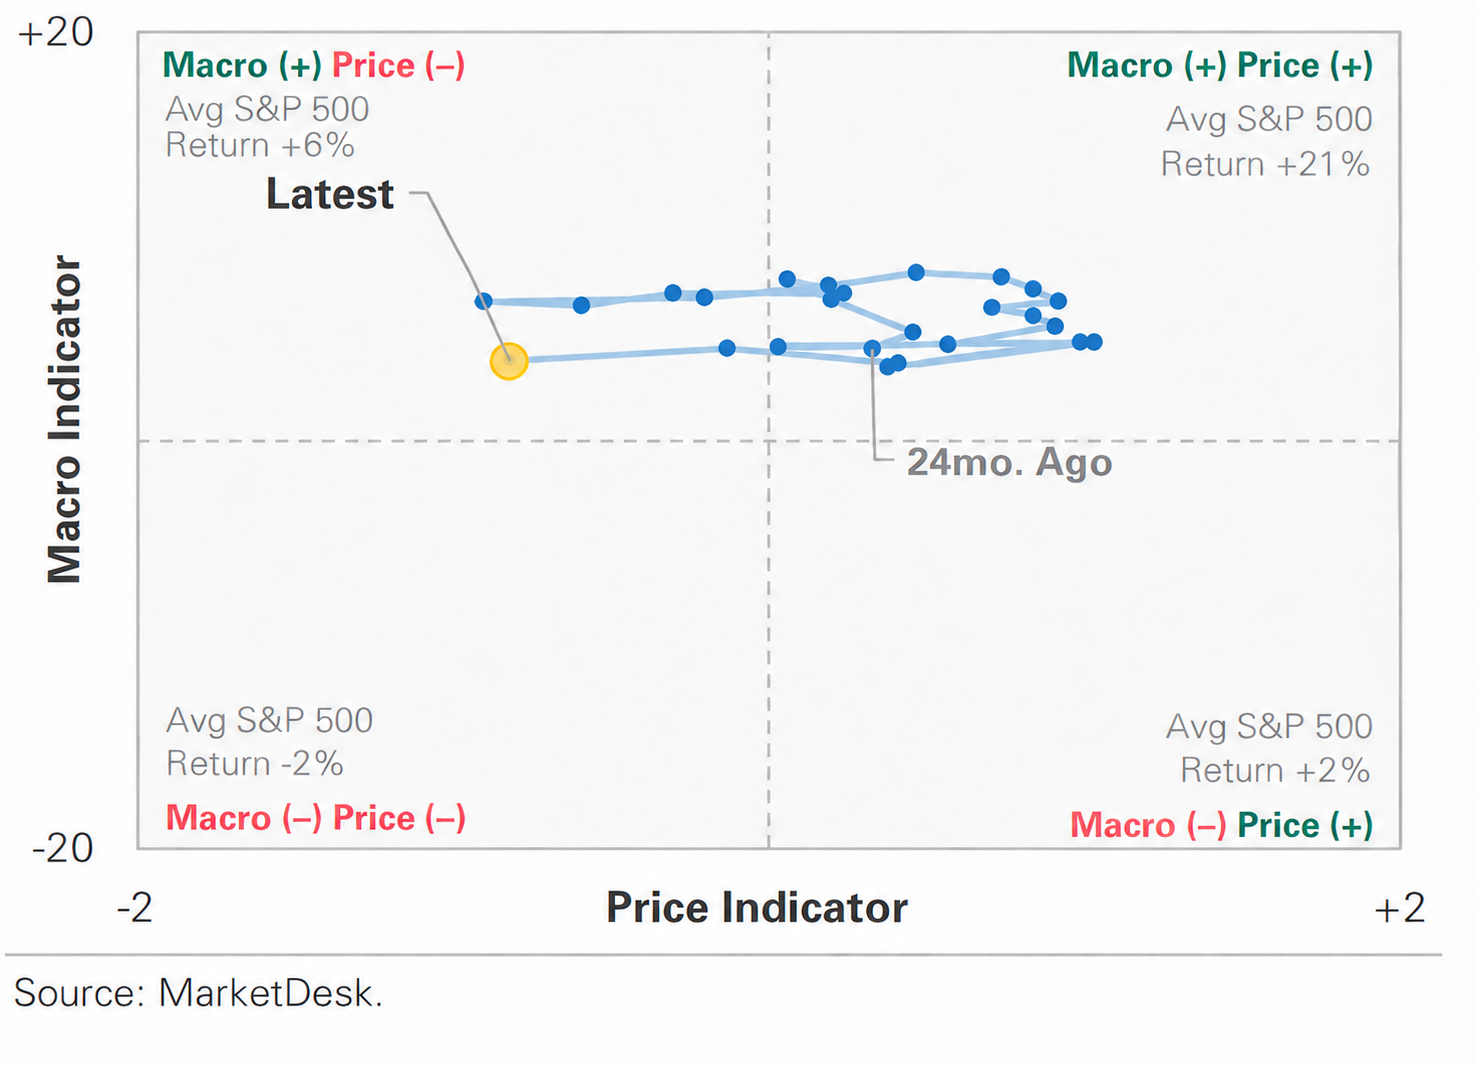
US Market Economic Cycle Indicator
The Market Cycle Indicator tracks two primary investor groups: macro investors and price-based investors. Macro investors rely on fundamental and economic data to guide their decisions, while price-based investors (or technical analysts) focus on price action, momentum, volume, and behavioral trends. The Indicator synthesizes these perspectives to identify the prevailing market regime.
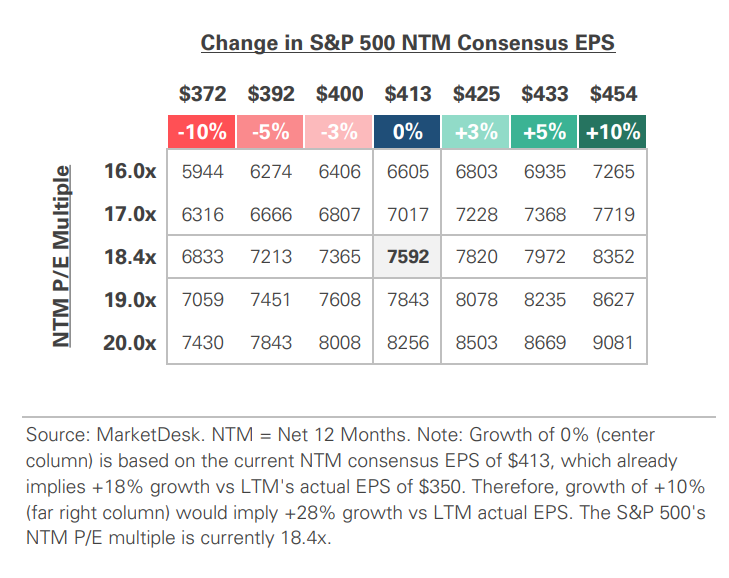
S&P 500 Valuation Matrix
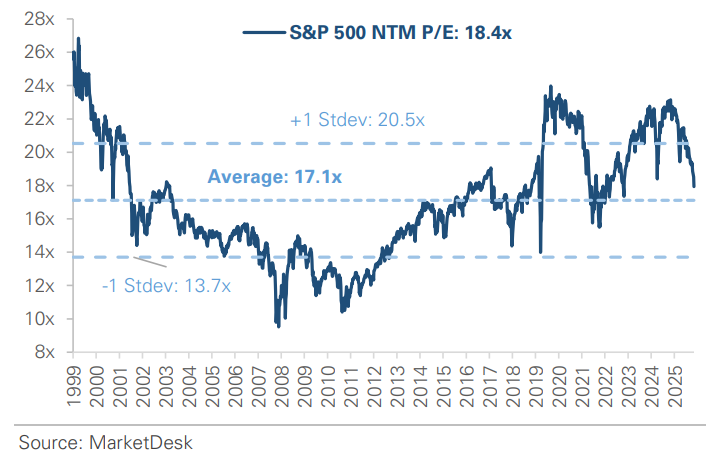
S&P 500 Forward PE Ratio
The S&P 500 forward price-to-earnings (P/E) ratio is a widely followed valuation metric that compares the index's current level to the projected earnings of its constituent companies over the next 12 months. The indicator implies to investors how much they are paying today for each dollar of expected future earnings.
Key Takeaways
#1 - Chips Rally Despite Nvidia’s Leadership Shake-Up
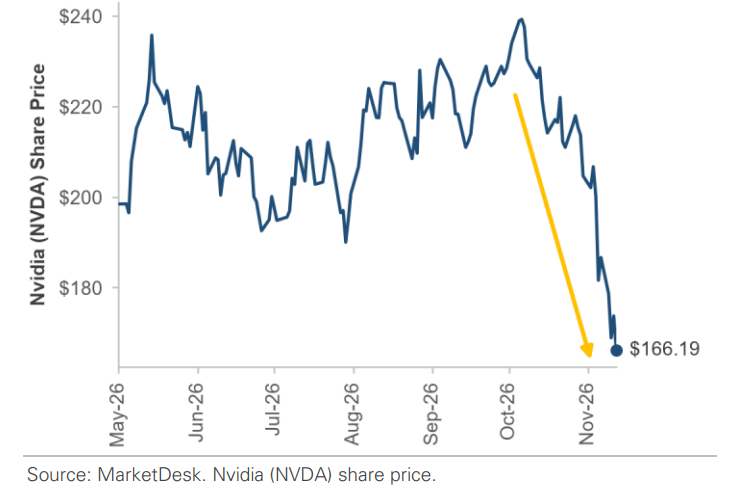
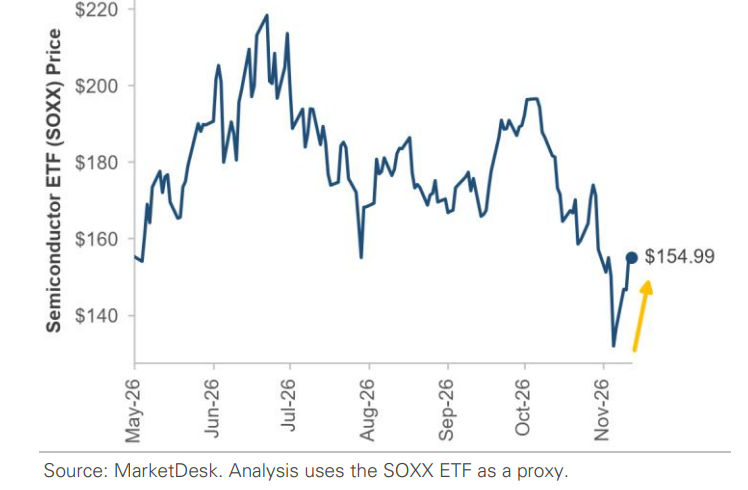
Huang resigned as CEO and from the board, effective immediately, days after the board opened an investigation into reports that he had been the target of a Chinese intelligence effort. Nvidia’s CFO will serve as interim CEO while the board searches for a permanent replacement, and the company said its operations and product plans will continue without interruption. Nvidia shares fell -14% at Thursday’s open before recovering most of the loss, leaving them more than -30% below their October record high. The broader chip group rallied: an index of semiconductor companies rose more than +15% for the week after strong results from CoreWeave, a cloud provider that rents out Nvidia chips, while rivals AMD and Broadcom gained on Thursday as Nvidia sold off.
Implication – Investors appear to view Nvidia’s leadership change as a company-specific concern rather than a sign of weakness in the broader AI industry, where demand remains strong.
Nvidia Slides Amid Leadership Turmoil
Chip Stocks Rebound Beyond Nvidia
#2 - Hiring Surges Past Expectations
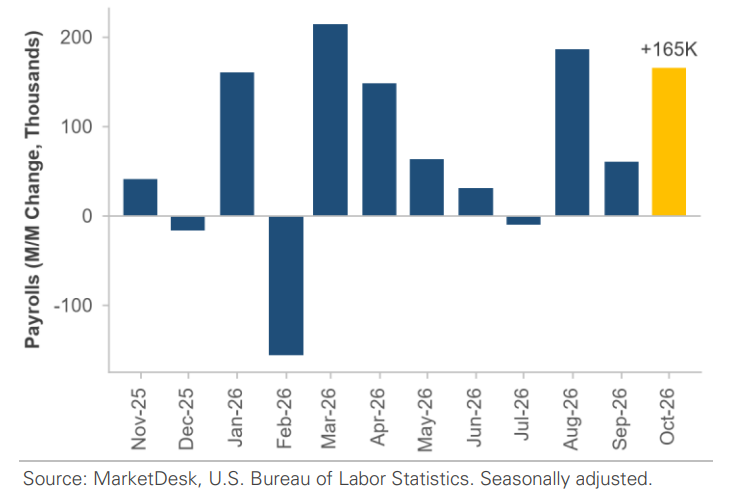
Nonfarm payrolls rose +165,000, well above the roughly +65,000 economists expected, and revisions added +84,000 jobs to August and September. The unemployment rate fell to 4.1%, and average hourly earnings rose +0.4% for the month and +3.1% from a year earlier. Professional and business services and health care led the gains, and manufacturing also added jobs, consistent with last week’s strong reading on factory activity.
Implication – Hiring has picked up, which supports household incomes and spending but leaves the Fed with less reason to hold rates steady
October Hiring Adds 165,000 Jobs
#3 - Hot Inflation Fuels Rate-Hike Bets
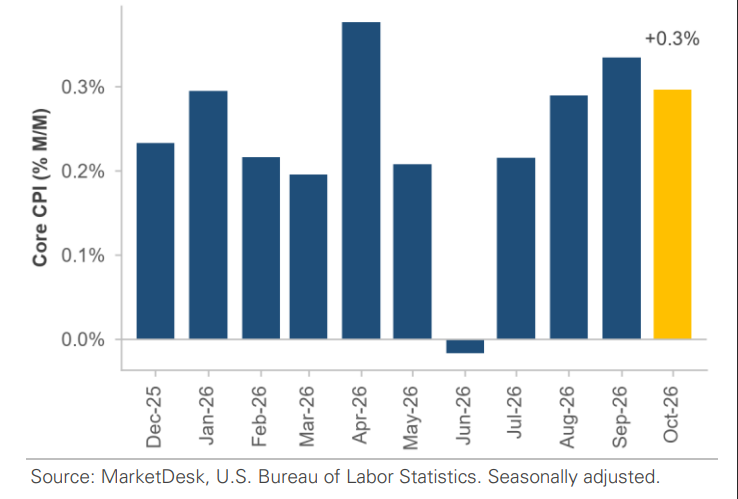
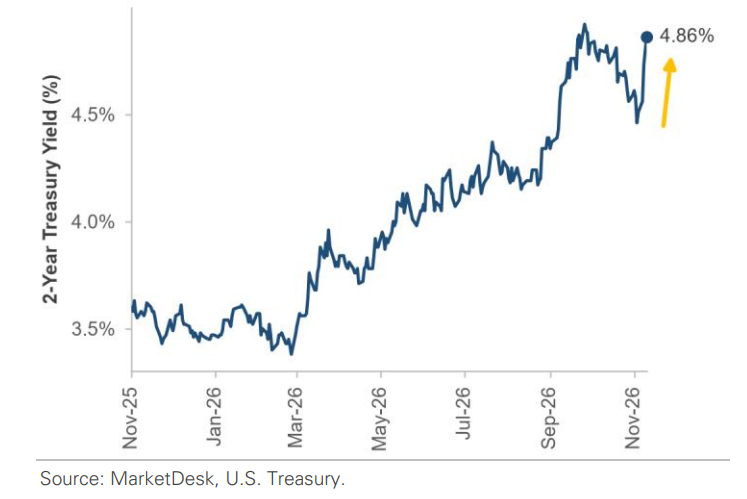
The Consumer Price Index rose +0.4% for the month, above the +0.3% expected, as energy and food prices both increased. Core prices, which exclude food and energy, rose +0.3% for a third straight month, above the +0.2% expected. The government could not publish 12-month inflation rates this month because October 2025 prices were never collected during last year’s government shutdown. Before the report, Fed Governor Christopher Waller said a half-point hike "should be considered" if core inflation came in around +0.3% or higher; afterward, Dallas Fed President Lorie Logan said she sees a need for two more 0.25% increases. Futures markets put the odds of a hike at the December 9 meeting at 85%, and the 2-year Treasury yield, which closely tracks rate expectations, rose about +0.4 percentage points for the week.
Implication – The market debate has shifted from whether the Fed raises rates to how many more increases could follow.
Core Inflation Holds at 0.3% for Three Months
Rate-Hike Bets Push Treasury Yields Higher
#4 - High Rates Keep Homebuyers Sidelined
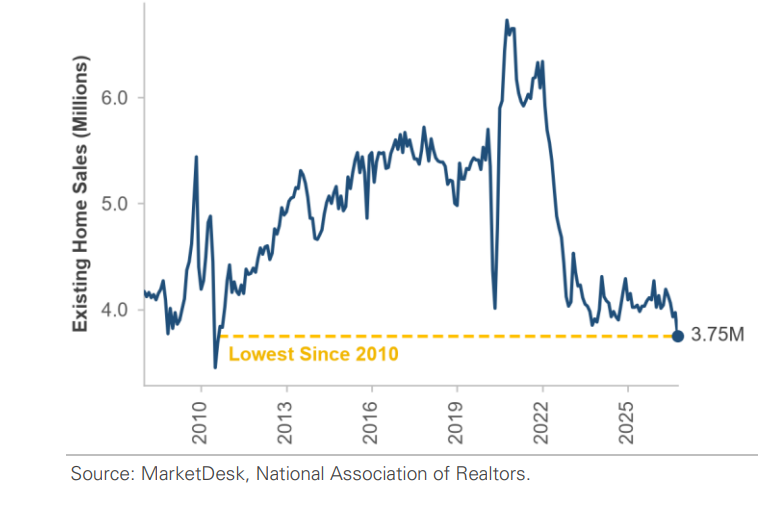
Sales of previously owned homes fell -5.5% in October to an annual rate of 3.75 million, and the median sale price rose only +0.4% from a year earlier as fewer buyers competed for homes. The average 30-year mortgage rate remains above 7%, and the 10-year Treasury yield, which guides mortgage rates, rose to 5.10% on Thursday.
Implication – Housing remains the clearest example of how higher borrowing costs are impacting the economy, even as hiring picks up
Home Sales Sink to Their Slowest Pace Since 2010
Important Disclosures
This material is provided for general and educational purposes only and is not investment advice. Your investments should correspond to your financial needs, goals, and risk tolerance. Please consult an investment professional before making any investment or financial decisions or purchasing any financial, securities, or investment-related service or product, including any investment product or service described in these materials.
Our Insights