

Photo Credit: Jonathan Chaves
Weekly Market Recap for November 20th
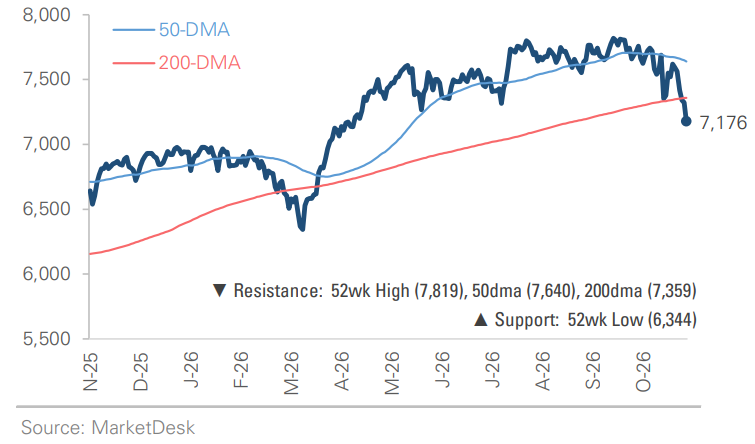
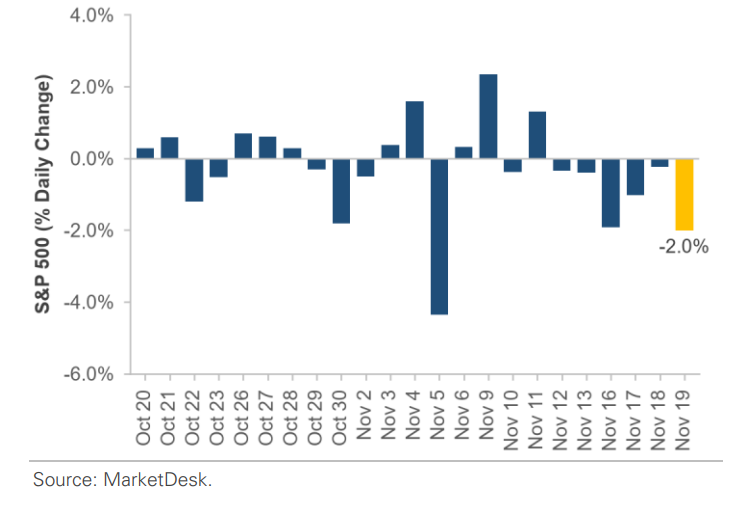
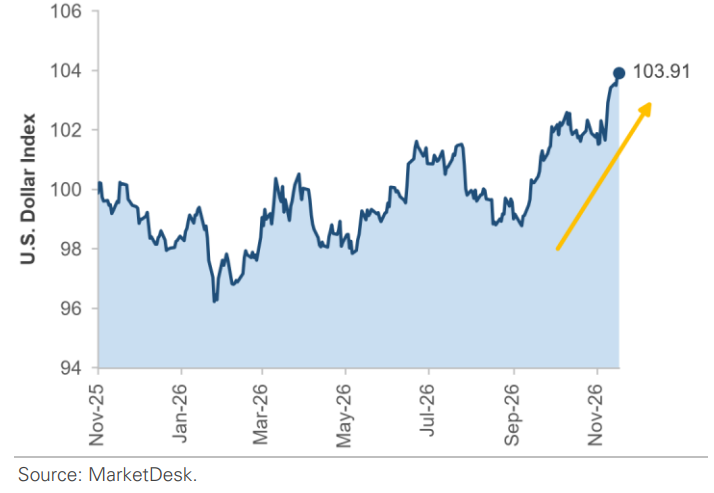
Stocks fell sharply as AI-related selling broadened and Fed officials pointed to further rate hikes. The S&P 500 fell -5.5% and posted its sixth straight daily loss, the Nasdaq and Dow Jones each fell more than -6%, and the Russell 2000 small-cap index fell more than -5%. The Equal-Weight S&P 500 fell less, while Momentum and High Beta stocks fell about -8%. All 11 sectors traded lower, led by Tech, while Consumer Staples and Utilities held up best. U.S. Treasuries traded higher as yields declined, with longer-maturity bonds outperforming, while high-yield corporate bonds underperformed investment-grade as credit spreads widened. Oil fell more than -5%, gold dropped to its lowest level in 14 months, Bitcoin fell more than -10%, and the VIX jumped above 25. Meanwhile, the U.S. dollar rose to its highest level since April 2025.
S&P 500 Index (Last 12 Months)
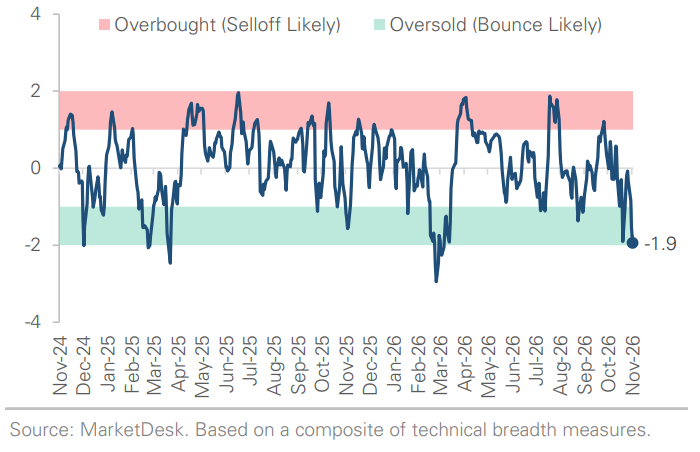
S&P 500 Technical Composite (Last 24 Months)
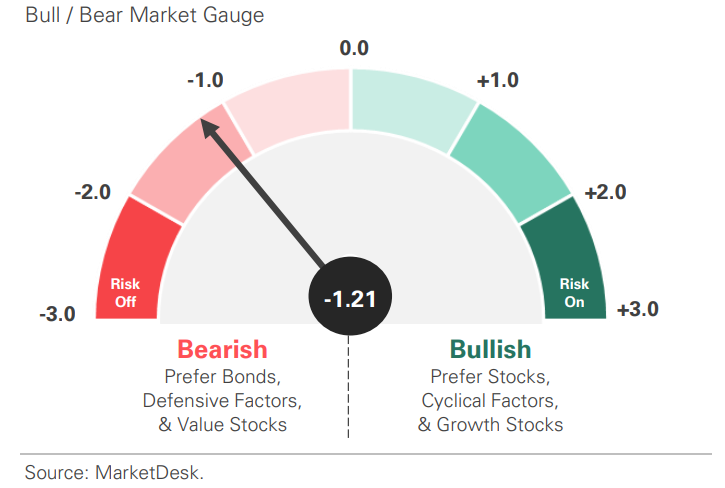
US Risk Demand Market Indicator
The US Risk Demand Indicator (USRDI) is a quantitative tool to measure real-time investor risk appetite. When the indicator is above zero, it signals a risk-on environment favoring cyclical sectors, high-beta stocks, high-yield corporate bonds, and hybrid (convertible) bonds. In contrast, a reading below zero signals a risk-off environment favoring defensive sectors, low-volatility stocks, and US Treasury bonds.
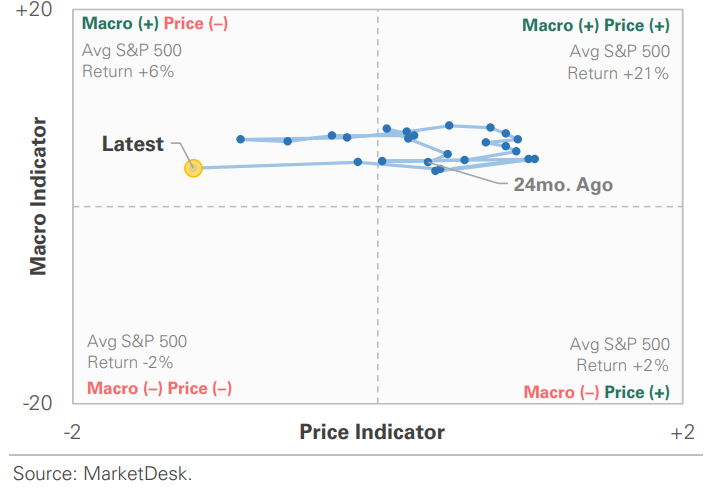
US Market Economic Cycle Indicator
The Market Cycle Indicator tracks two primary investor groups: macro investors and price-based investors. Macro investors rely on fundamental and economic data to guide their decisions, while price-based investors (or technical analysts) focus on price action, momentum, volume, and behavioral trends. The Indicator synthesizes these perspectives to identify the prevailing market regime.
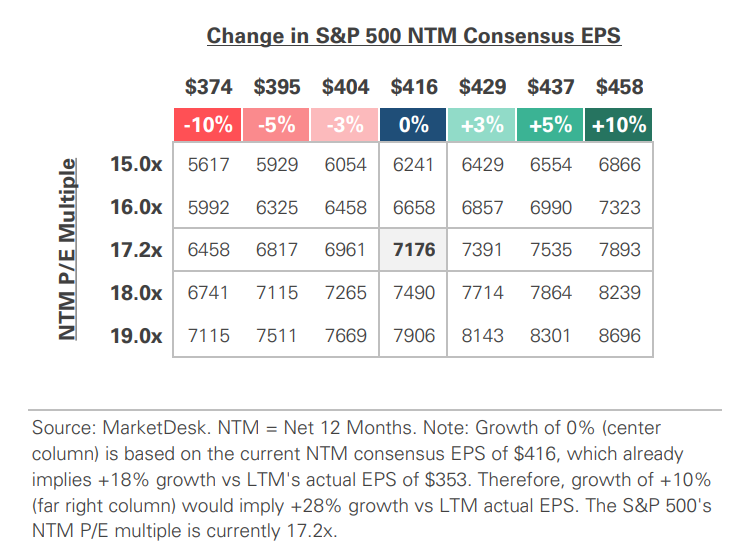
S&P 500 Valuation Matrix
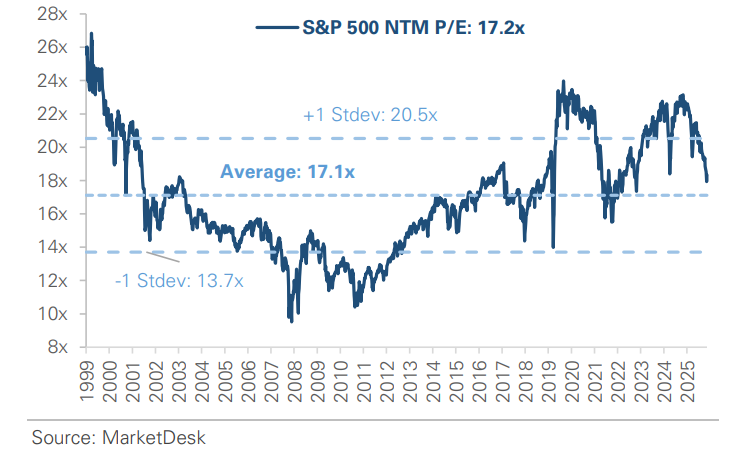
S&P 500 Forward PE Ratio
The S&P 500 forward price-to-earnings (P/E) ratio is a widely followed valuation metric that compares the index's current level to the projected earnings of its constituent companies over the next 12 months. The indicator implies to investors how much they are paying today for each dollar of expected future earnings.
Key Takeaways
#1 - AI’s Selloff Spreads Beyond Tech
The S&P 500 fell to its lowest level since April, and the Nasdaq closed more than -10% below its October record, entering a correction. Nvidia's quarterly revenue rose +103% from a year earlier to $115.8 billion, and its forecast beat estimates, but its shares gave back their early gains. Earlier in the week, a Commerce Department rule restricted Chinese companies' access to advanced chips through foreign data centers. Anthropic raised $81.3 billion in the largest IPO on record, and its shares rose more than +15% in their Thursday debut, but most stocks fell.
Implication – The pullback in AI stocks that began in October has broadened to the rest of the market, even as AI companies continue to report strong growth
Six Straight Losses as Selling Spreads
#2 - The Fed Signals More Hikes
Fed Governor Christopher Waller said a half-point hike is "probably necessary" at the December 8-9 meeting and that the Fed may need to reverse all three of last year's cuts and possibly go further. Minutes of the October meeting showed that "almost all participants" expected further hikes, and many officials described the AI buildout as "a material source of inflation risk." The New York Fed President struck a more measured tone, saying the situation does not call for "dramatic action." Futures markets put the odds of a December rate hike at about 96% and the odds of another hike in January at about 73%.
Implication – Unlike in many past selloffs, the Fed is signaling more rate hikes rather than cuts, as officials now count AI spending among the risks to inflation.
Dollar Climbs to a 19-Month High
#3 - Consumers Keep Spending
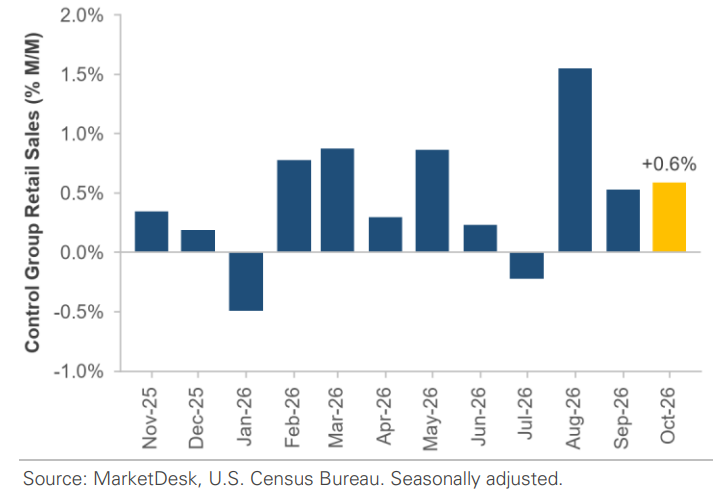
Retail sales rose +0.2% for the month, in line with expectations, but the control group, which feeds into GDP and excludes autos, gasoline, building materials, and restaurants, rose +0.6%, above the roughly +0.3% to +0.4% expected. Retailer earnings this week provided additional color. Target's comparable sales rose +5.6%, its best growth in more than five years, and TJX's comparable sales rose +4%. Walmart's revenue rose +5.2% to $188.8 billion, above estimates, and the company raised its full-year earnings forecast.
Implication – Spending stayed resilient through October despite higher borrowing costs and falling stock prices, a sign that household finances are holding up for now.
Retail Spending Beats Expectations
#4 - Credit Markets Turn Cautious
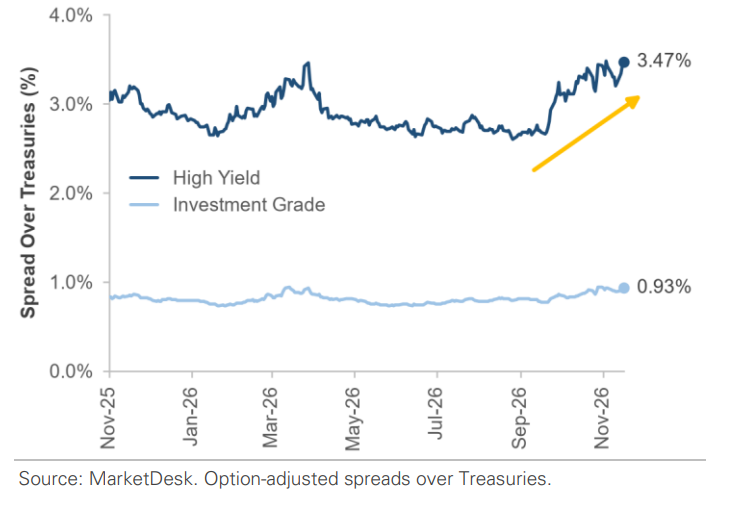
The extra yield investors demand to hold high-yield corporate bonds instead of Treasuries rose +0.17 percentage point in the week through Wednesday to 3.47%, just below its one-year high. The spread on CCC-rated bonds, the lowestrated tier of high-yield, rose to 13.53%, also near its one-year high, while investment-grade spreads widened only slightly. On a related note, the Fed's minutes referenced the rapid growth of debt tied to the AI buildout, much of it through "complex and opaque financing structures."
Implication – Wider spreads show that investors are demanding more compensation to lend to riskier companies, although spreads remain well below the levels seen in past periods of severe stress.
Riskier Borrowers Face Wider Spreads
Important Disclosures
This material is provided for general and educational purposes only and is not investment advice. Your investments should correspond to your financial needs, goals, and risk tolerance. Please consult an investment professional before making any investment or financial decisions or purchasing any financial, securities, or investment-related service or product, including any investment product or service described in these materials.
Our Insights