Fed Holds Rates Steady, Oil Prices Reverse Lower, and Q2 GDP Slows

Photo Credit: Getty Images Unsplash
Weekly Market Recap for August 7th
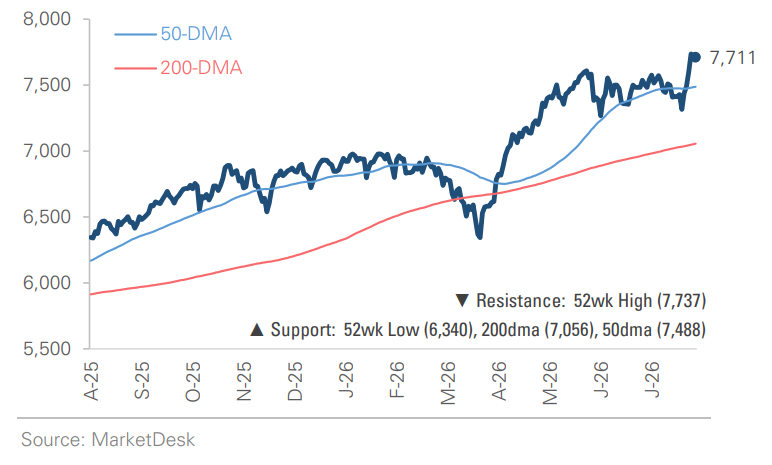
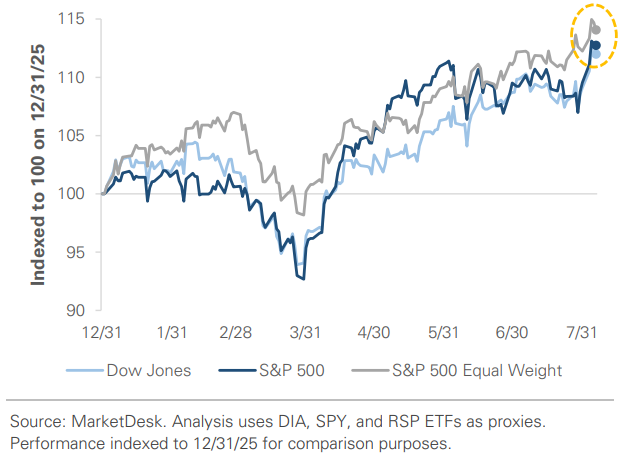
This week, markets rebounded as geopolitical tensions eased and oil prices declined. The S&P 500 gained nearly +4% and set a new all-time high, with the Dow Jones, S&P 500 Equal Weight, and Russell 2000 also setting records. Technology, Consumer Discretionary, and Communication Services led all sectors, as the mega-cap tech stocks known as the Magnificent 7 gained nearly +6.5%. Energy was the worst-performing sector as oil prices fell nearly -7%, with defensive sectors also lagging the stock market rally. Bonds gained as oil and Treasury yields fell. Shorter maturity bonds outperformed as easing inflation fears trimmed the odds of a rate hike, while high-yield corporates outperformed as credit spreads re-tightened, a sign of risk appetite. The U.S. dollar strengthened slightly, the VIX declined, and gold rose to its highest since mid-June.
S&P 500 Index (Last 12 Months)
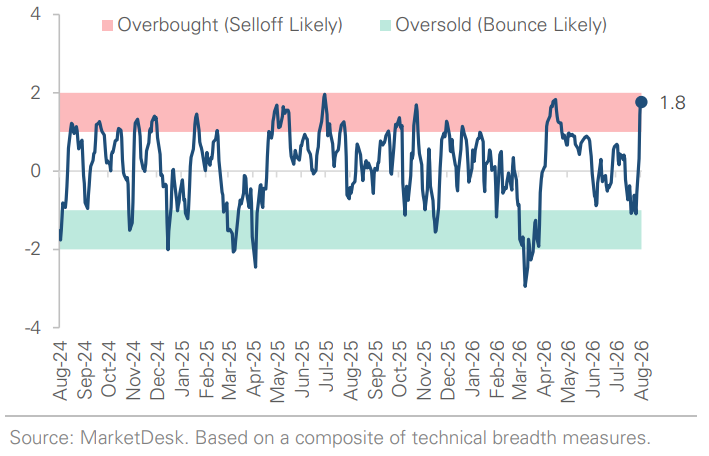
S&P 500 Technical Composite (Last 24 Months)
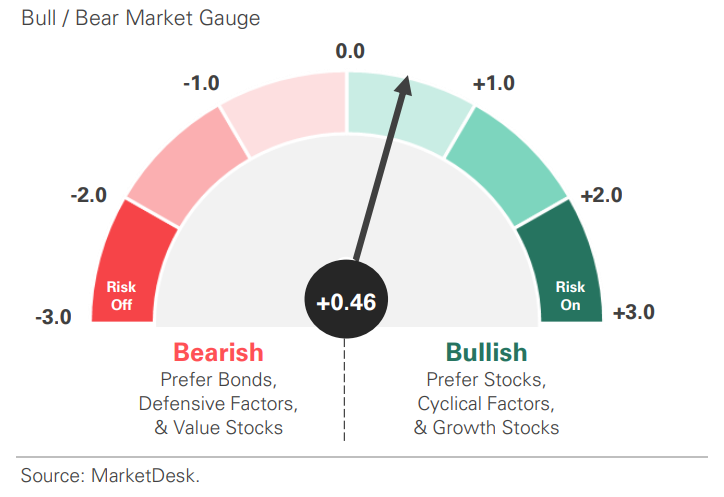
US Risk Demand Market Indicator
The US Risk Demand Indicator (USRDI) is a quantitative tool to measure real-time investor risk appetite. When the indicator is above zero, it signals a risk-on environment favoring cyclical sectors, high-beta stocks, high-yield corporate bonds, and hybrid (convertible) bonds. In contrast, a reading below zero signals a risk-off environment favoring defensive sectors, low-volatility stocks, and US Treasury bonds.
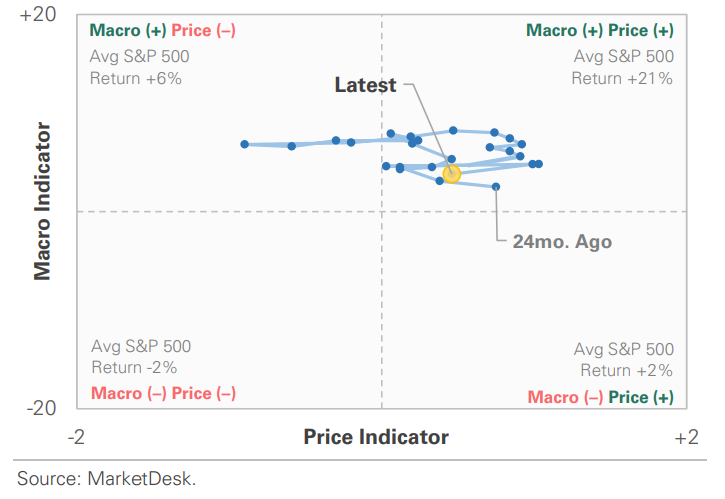
US Market Economic Cycle Indicator
The Market Cycle Indicator tracks two primary investor groups: macro investors and price-based investors. Macro investors rely on fundamental and economic data to guide their decisions, while price-based investors (or technical analysts) focus on price action, momentum, volume, and behavioral trends. The Indicator synthesizes these perspectives to identify the prevailing market regime.
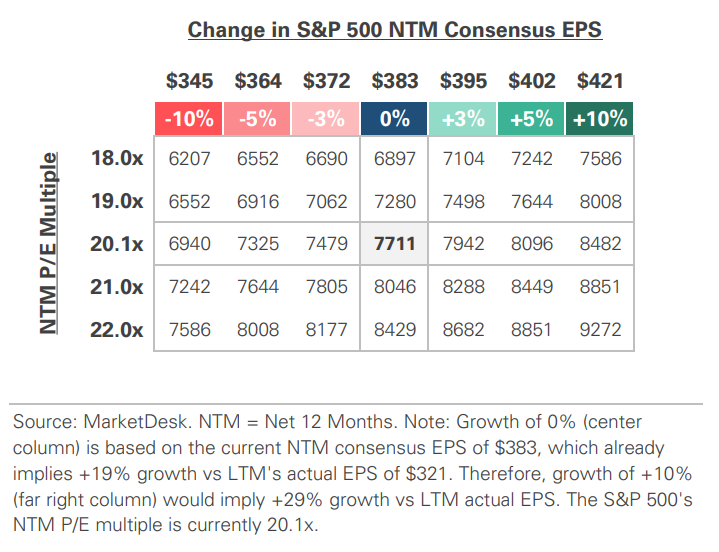
S&P 500 Valuation Matrix
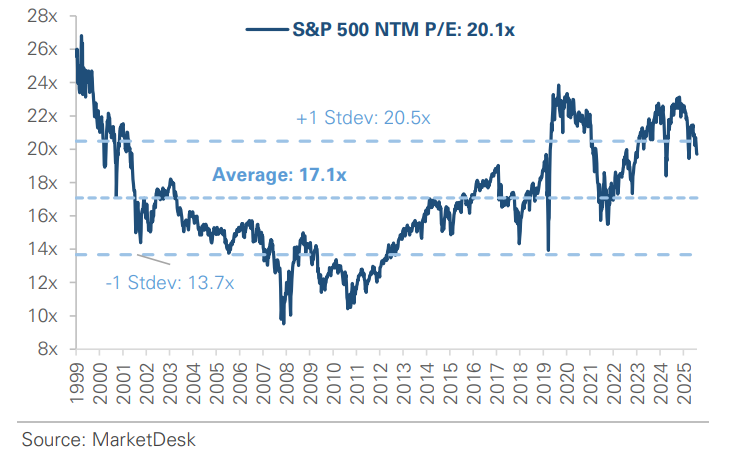
S&P 500 Forward PE Ratio
The S&P 500 forward price-to-earnings (P/E) ratio is a widely followed valuation metric that compares the index's current level to the projected earnings of its constituent companies over the next 12 months. The indicator implies to investors how much they are paying today for each dollar of expected future earnings.
Key Takeaways
#1 - Interest Rates Unchanged
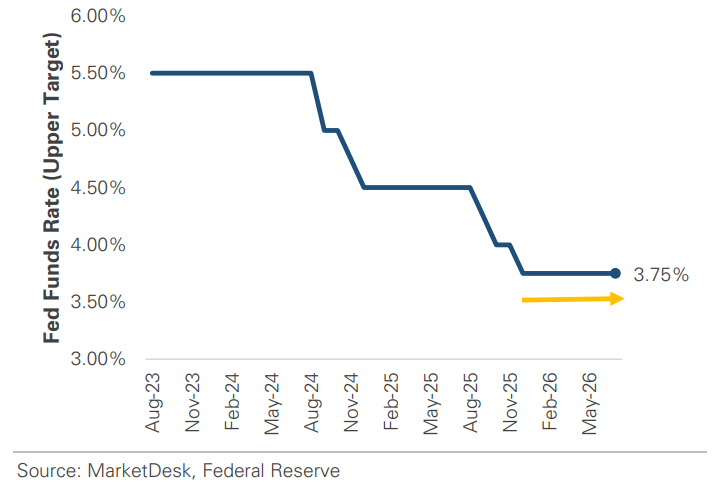
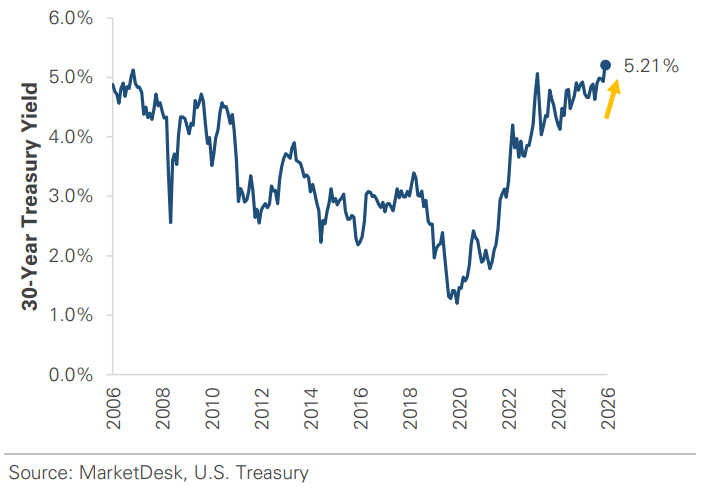
The Federal Reserve left interest rates unchanged at last week’s meeting. The Fed held its benchmark rate at 3.50% to 3.75% for a fifth consecutive meeting, the second under Chair Kevin Warsh. Three officials dissented in favor of a quarter-point increase, the most in that direction since 2016, and Warsh offered little guidance on the path ahead. Stocks declined, and Treasury yields rose to multi-year highs after the decision, with the 30-year yield trading near a 19-year high, amid concern that the Fed was not moving fast enough on inflation and might have to raise rates further. Markets place around a 60% probability on a hike at the September meeting.
Implication: The Fed is providing less guidance on its intentions, making its policy path harder to forecast and, in turn, making interest rates more volatile.
Federal Reserve Continues to Hold Interest Rates Steady
30-Year Treasury Yield Rises to 19-Year High
#2 - Oil Prices Remain Volatile
Oil prices remain volatile as the conflict in the Middle East swings between escalation and de-escalation. Oil spiked more than +30% in July as the U.S.-Iran conflict escalated again, with West Texas Intermediate crude above $90 a barrel. It has since reversed by nearly -20% as a planned U.S. strike was paused and talks turned to reopening the Strait of Hormuz, a critical route for global oil trade. Crude now trades near $75, roughly where it stood before the latest flare-up in early July. The headlines and move in oil prices are the latest in a pattern that has repeated multiple times this year, with each escalation followed by a round of de-escalation and one set of headlines countered by the next.
Implication: The conflict and swings in oil prices have added to interest-rate volatility and uncertainty about Fed policy.
#3 - Big Tech Earnings
Several big tech companies reported quarterly results last week, and the market’s reaction was varied. The difference came down to how much growth each could show in return for its AI spending. Microsoft rose +16% after its Azure cloud business grew +43%, the biggest one-day market-value gain for a stock on record, and Amazon gained +10% after its cloud division drove the first-ever $200 billion quarter. In contrast, Meta declined as its heavy AI spending and a profit miss weighed on its ad business.
Implication: Investors are differentiating among the big tech companies, rewarding clear returns from AI spending and becoming more cautious about the rest.
Broad Market Equity Indices Set New Highs
#4 - Headline vs Core Growth
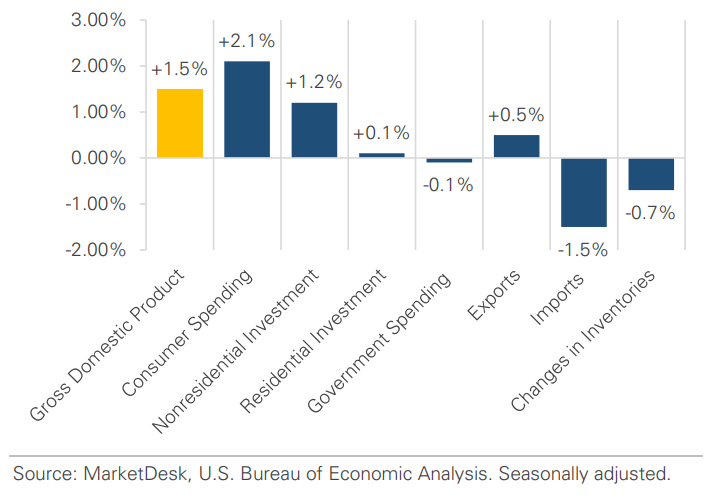
Headline economic growth slowed in Q2, though core growth remained solid. The U.S. economy grew at a +1.5% annualized rate from April through June, down from +2.1% in Q1. The slowdown traced mainly to an increase in imports, which count against GDP, and a decline in government spending. A measure of private demand that combines consumer spending and business investment rose +3.9%, more than double the +1.7% pace of the first quarter, as consumers continued to spend.
Implication: The economy’s core held up despite the slowdown, with consumer and business demand still growing even as the headline number cooled.
Contribution to Q2 GDP Growth
#5 - Manufacturing Rises to a 4 Year High
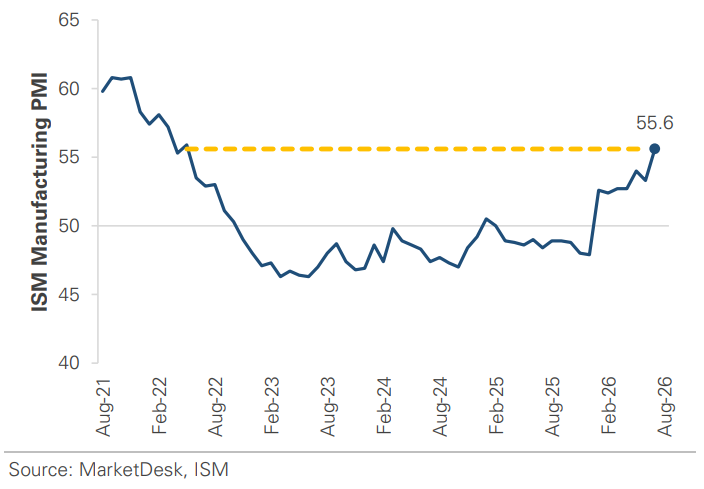
Manufacturing activity rose to a four-year high in July. A widely followed gauge of factory activity, the ISM’s manufacturing index, rose to 55.6 in July from 53.3 in June, its strongest reading since 2022. A level above 50 signals expansion. The improvement was broad: production led the gain, new orders held firm, factory hiring expanded for the first time in nearly three years, and cost pressures eased.
Implication – Manufacturing continues to strengthen after several sluggish years, when elevated interest rates and reduced capital spending weighed on activity.
ISM Manufacturing PMI Rises to a 4-Year High
Important Disclosures
This material is provided for general and educational purposes only and is not investment advice. Your investments should correspond to your financial needs, goals, and risk tolerance. Please consult an investment professional before making any investment or financial decisions or purchasing any financial, securities, or investment-related service or product, including any investment product or service described in these materials.
Our Insights