Fed Meeting, U.S.-Iran Deal, Consumer Spending, and SpaceX IPO

Photo Credit: Planet Volumes, Unsplash
Weekly Market Recap for June 19th
This week, Markets traded higher with gains concentrated in the semiconductor industry and AI beneficiaries. Mega-cap tech’s strength lifted the S&P 500 +1.4% and the Nasdaq Composite +3.1%, while the equal-weight S&P 500 was essentially flat at +0.1%. Technology led all S&P 500 sectors, up 4.4%, followed by Industrials at +3.2%. While about half the sectors rose, only three of the eleven beat the index, with energy the clear laggard at -5.9%. Bonds ended the week flat, with the long end the exception, which outperformed as falling oil prices eased inflation fears. Commodities fell sharply, with oil falling 13% as the U.S. and Iran agreed to a framework to end the conflict. The U.S. dollar strengthened, while Bitcoin continued to trade lower.
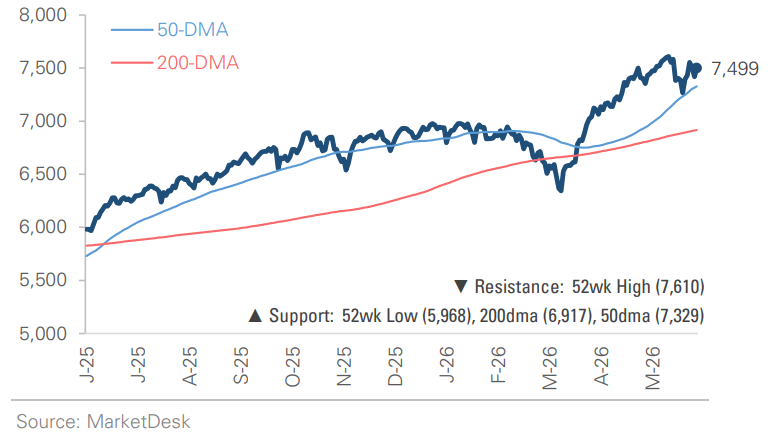
S&P 500 Index (Last 12 Months)
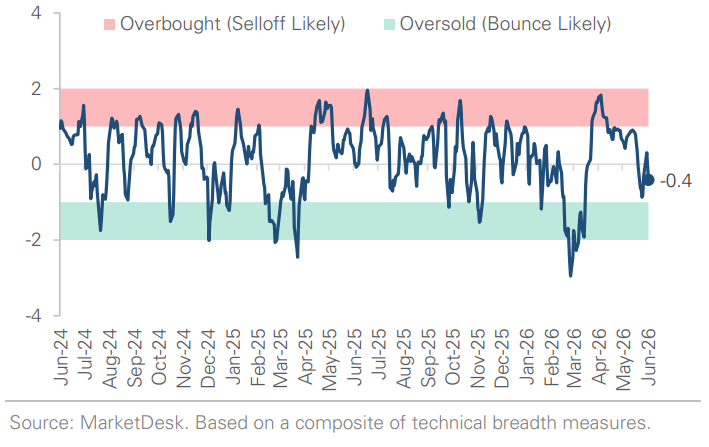
S&P 500 Technical Composite (Last 24 Months)
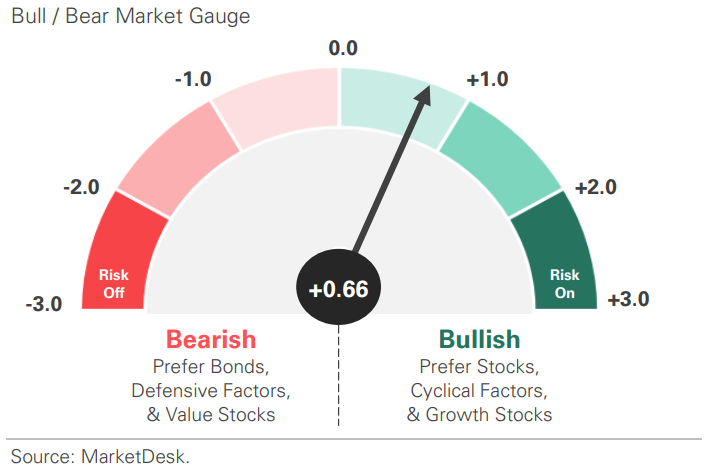
US Risk Demand Market Indicator
The US Risk Demand Indicator (USRDI) is a quantitative tool to measure real-time investor risk appetite. When the indicator is above zero, it signals a risk-on environment favoring cyclical sectors, high beta stocks, high-yield corporate bonds, and hybrid (convertible) bonds. In contrast, a reading below zero signals a risk-off environment favoring defensive sectors, low-volatility stocks, and US Treasury bonds.
US Market Economic Cycle Indicator
The Market Cycle Indicator tracks two primary investor groups: macro investors and price-based investors. Macro investors rely on fundamental and economic data to guide their decisions, while price-based investors (or technical analysts) focus on price action, momentum, volume, and behavioral trends. The Indicator synthesizes these perspectives to identify the prevailing market regime.

S&P 500 Valuation Matrix
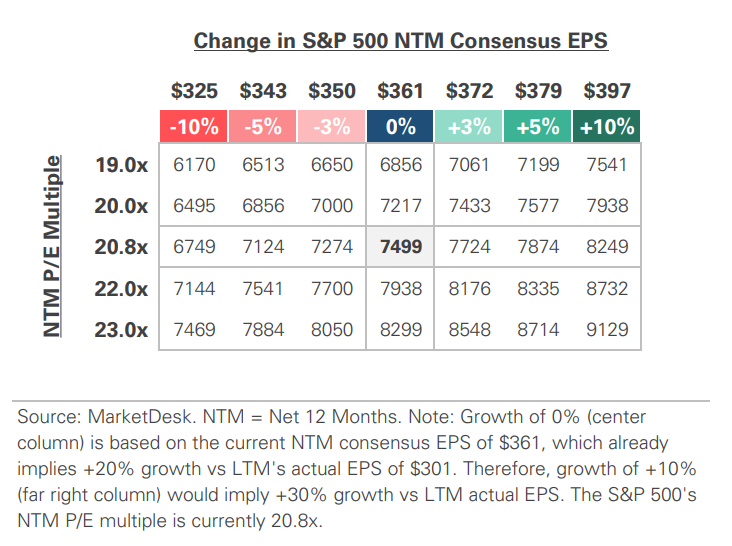
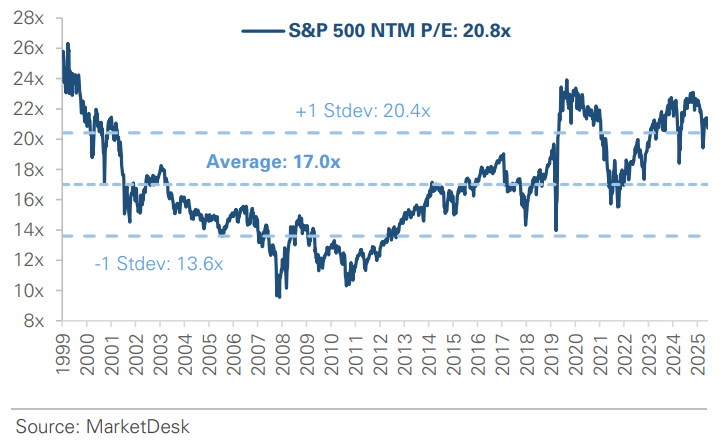
S&P 500 Forward PE Ratio
The S&P 500 forward price-to-earnings (P/E) ratio is a widely followed valuation metric that compares the index's current level to the projected earnings of its constituent companies over the next 12 months. The indicator implies to investors how much they are paying today for each dollar of expected future earnings.
Key Takeaways
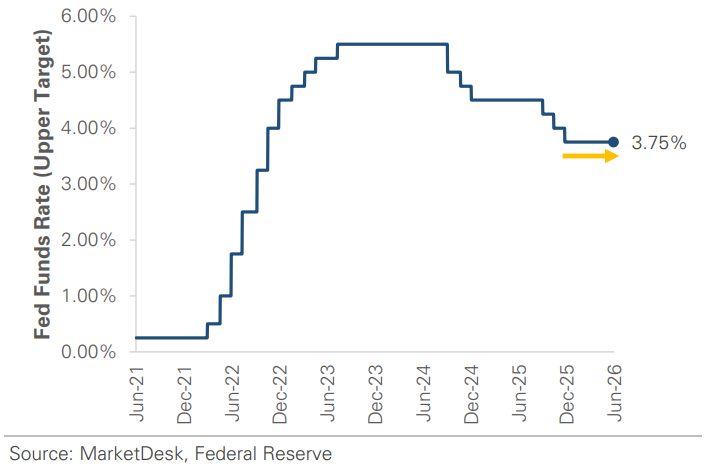
#1 - Interest Rates Hold Steady
The Federal Reserve held rates steady this week but signaled that its next move is more likely a hike than a cut. Kevin Warsh chaired his first meeting as Fed chair, and the committee left the federal funds rate unchanged at 3.50%-3.75%. The shift was in the messaging. Updated projections show officials now expect rates to end 2026 higher than they are today, a reversal from March, when most still penciled in a cut. Nine of eighteen officials now forecast at least one hike this year. The Fed also raised its year-end inflation forecast after consumer prices rose +4.2% from a year ago in May, the hottest reading since 2023.
Implication: The Fed’s pivot marks a real change in direction. After leaning toward cuts for most of the past year, the Fed is now treating sticky inflation as a bigger risk than slowing growth.
Federal Reserve Holds Interest Rates Steady
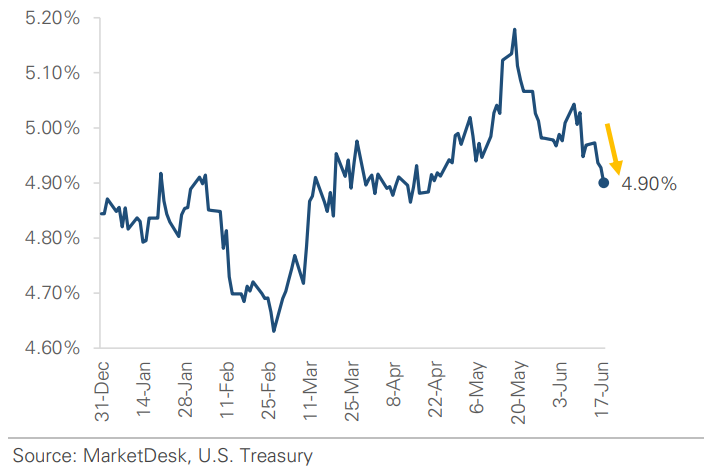
30-Year Treasury Yield Declines as Inflation Fears Ease
#2 - End of Iran War
The U.S. and Iran reached a framework to end their war, and oil prices fell sharply. The two sides announced a 60-day memorandum of understanding to end the fighting that began in late February and reopen the Strait of Hormuz, the waterway that carries nearly 20% of the world’s oil. Oil dropped on the news, with U.S. crude sliding back into the mid-$70s for the first time since early March. Treasury yields also declined as falling oil prices eased inflation concerns. Despite the agreement, key issues, including Iran’s nuclear program, are still unresolved.
Implication: The agreement targets the source of this year’s energy shock. Reopening the Strait of Hormuz would restore a major route of global oil supply, which is why crude and yields fell so fast, though the relief depends on the deal holding up.
Oil Falls into the Mid-$70s

#3 -US Consumer Spending Rises
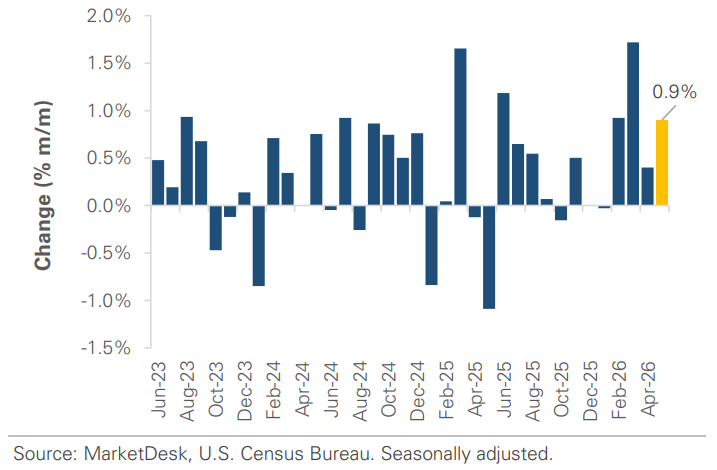
Consumers continued to spend in May. Retail sales rose +0.9% month-over-month, nearly double what economists expected, and climbed +6.9% from a year earlier. Gas station sales got a boost from higher gasoline prices, but spending also held up in non-gas categories. The control group, which excludes volatile categories and feeds into GDP growth, increased +0.7%, signaling solid underlying spending.
Implication: The report reinforced the view that consumer spending remains strong despite higher fuel costs and inflation pressures. It increases confidence in near-term economic growth, but it also gives the Fed another reason to keep rates higher for the long term.
Consumer Spending Remains Strong
Industrial Production Holds Steady in May

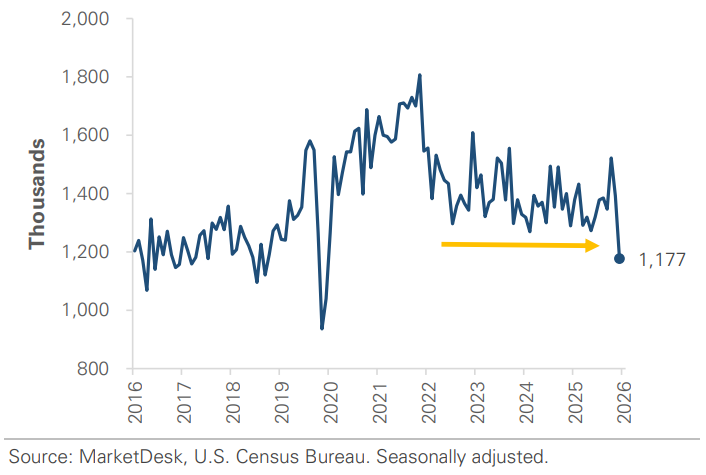
Housing Starts Remain Sluggish
#4 -SpaceX Completes Largest IPO in History
SpaceX went public last Friday, raising roughly $75 billion. Its stock jumped +19% on the first day of trading, valuing the company at more than $2 trillion, even though it is not yet profitable. Investors are treating the debut as an early test of appetite for a coming wave of artificial intelligence listings, with OpenAI and Anthropic among the companies reportedly preparing to go public later this year.
Implication: A strong first day suggests public markets are willing to absorb very large companies that are not yet making money, a useful read on investor confidence. It also clears the way for the bigger wave of technology IPOs expected later this year.
Important Disclosures
This material is provided for general and educational purposes only and is not investment advice. Your investments should correspond to your financial needs, goals, and risk tolerance. Please consult an investment professional before making any investment or financial decisions or purchasing any financial, securities, or investment-related service or product, including any investment product or service described in these materials.
Our Insights


