Oil Prices, Interest Rates Rise and Next Week's Calendar

Photo Credit: Worksite, Unsplash
Weekly Market Recap for July 24th
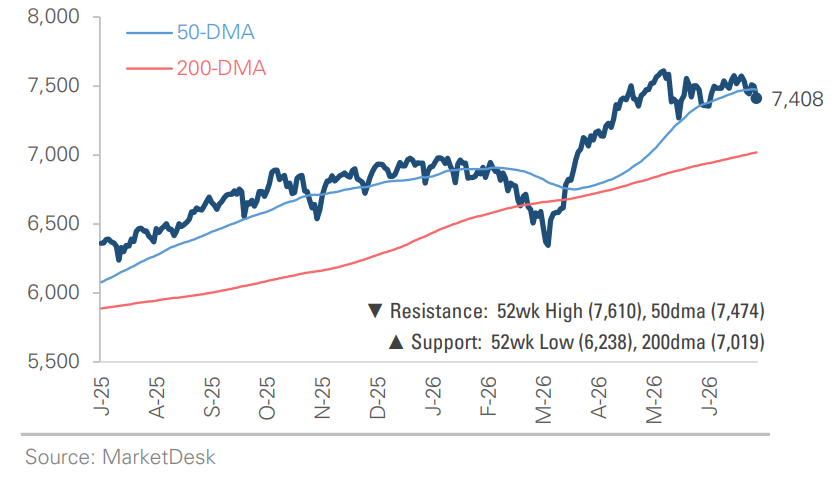
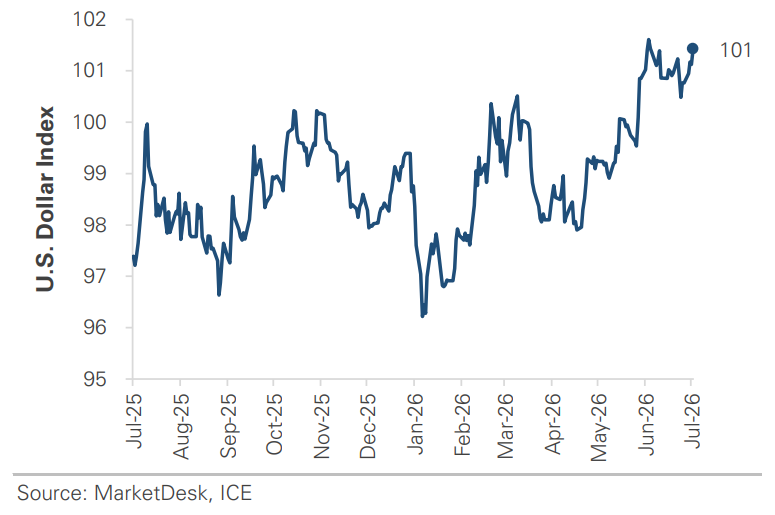
This week, markets traded lower as geopolitical tensions escalated in the Middle East and oil prices surged +17%. The S&P 500 and Nasdaq each declined around -2%, with the Russell 2000 close behind at -1.5%. Most equity factors traded lower, including Growth, Value, and Equal Weight, with market breadth weakening. The two exceptions were Momentum and High Beta, which outperformed after trading lower in recent weeks as semiconductor stocks sold off. Energy and Utilities were the top-performing sectors, while Consumer Discretionary declined nearly -7% as rising oil prices weighed on consumer stocks. Bonds traded lower as interest rates rose across the yield curve, with longer-maturity bonds underperforming. The VIX climbed back toward 20 late in the week, and the U.S. dollar strengthened as interest rates rose and markets turned volatile.
S&P 500 Index (Last 12 Months)
S&P 500 Technical Composite (Last 24 Months)
US Risk Demand Market Indicator
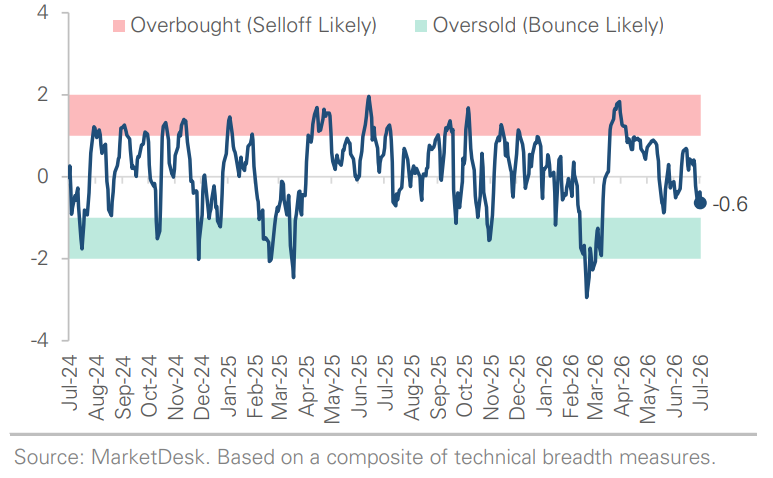
The US Risk Demand Indicator (USRDI) is a quantitative tool to measure real-time investor risk appetite. When the indicator is above zero, it signals a risk-on environment favoring cyclical sectors, high-beta stocks, high-yield corporate bonds, and hybrid (convertible) bonds. In contrast, a reading below zero signals a risk-off environment favoring defensive sectors, low-volatility stocks, and US Treasury bonds.
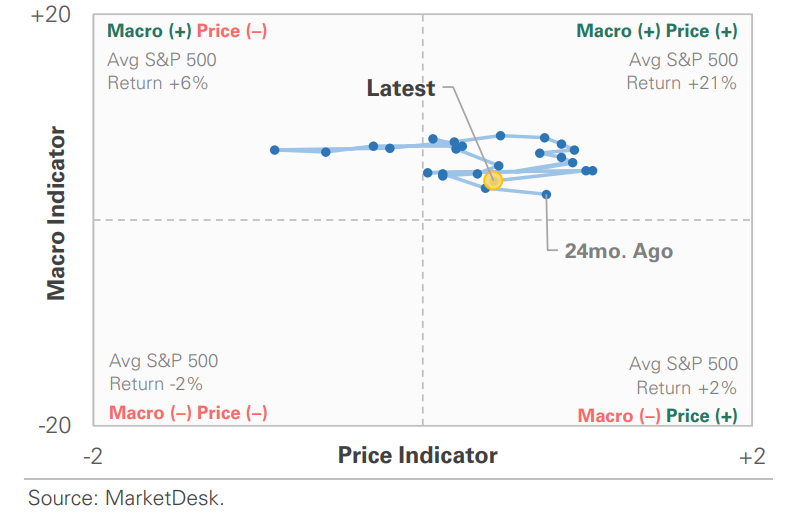
US Market Economic Cycle Indicator
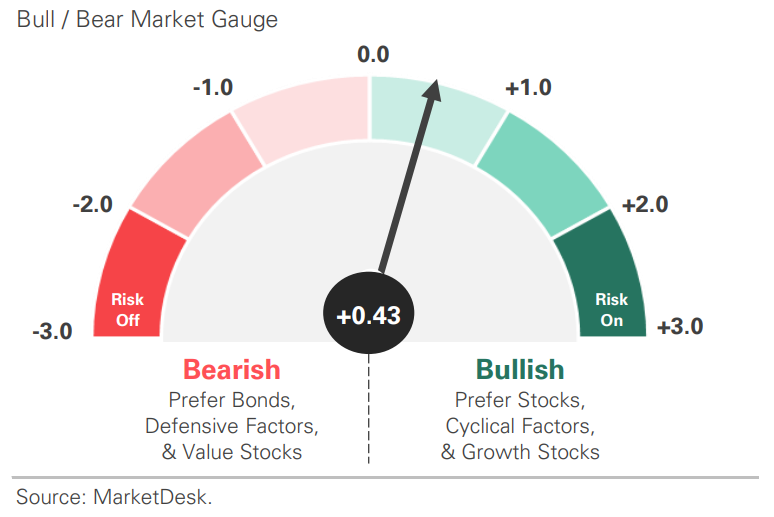
The Market Cycle Indicator tracks two primary investor groups: macro investors and price-based investors. Macro investors rely on fundamental and economic data to guide their decisions, while price-based investors (or technical analysts) focus on price action, momentum, volume, and behavioral trends. The Indicator synthesizes these perspectives to identify the prevailing market regime.
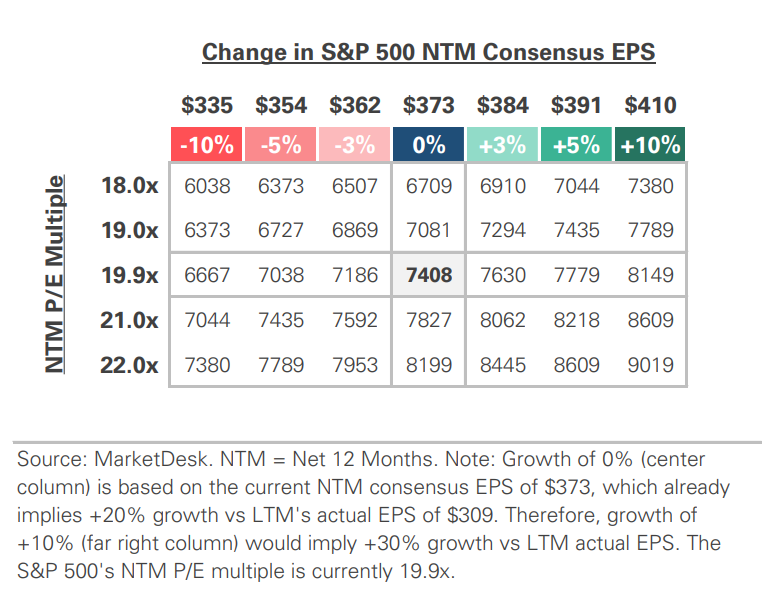
S&P 500 Valuation Matrix
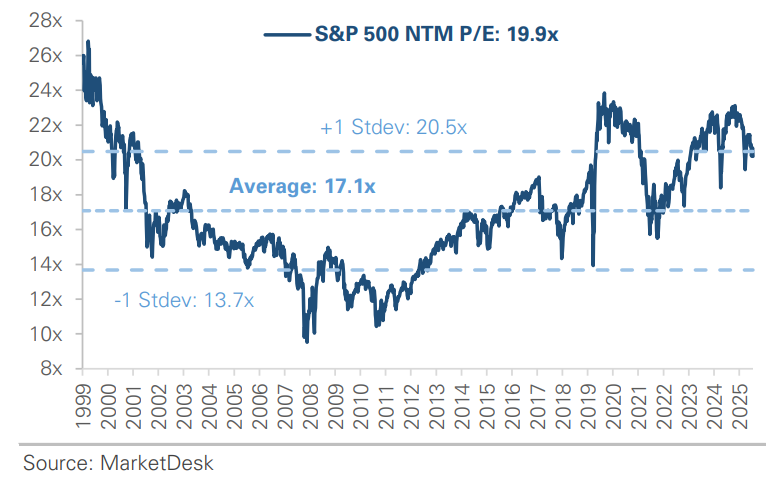
S&P 500 Forward PE Ratio
The S&P 500 forward price-to-earnings (P/E) ratio is a widely followed valuation metric that compares the index's current level to the projected earnings of its constituent companies over the next 12 months. The indicator implies to investors how much they are paying today for each dollar of expected future earnings.
Key Takeaways
#1 - Oil Prices Rise
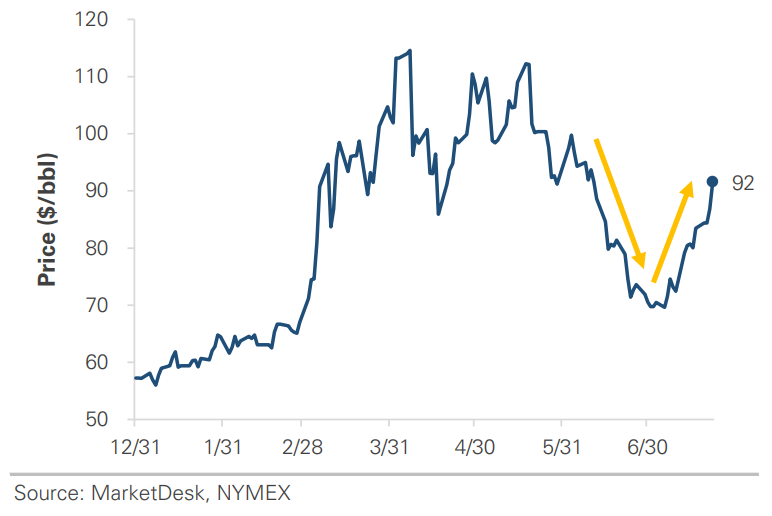
Oil prices continued to rise this week as the U.S.-Iran conflict escalated further. The U.S. carried out a 12th consecutive night of strikes, and Iran continued targeting tankers in the Strait of Hormuz, the waterway that carries a large share of the world’s oil trade. Yemen’s Houthi rebels escalated tensions by threatening a naval blockade against Saudi Arabia and opening a second source of disruption in the Red Sea. Oil prices rose in response: WTI crude climbed above $90 and Brent crude, the international benchmark, briefly touched $100 a barrel, both around six-week highs. Diplomatic progress has been limited, with Secretary of State Marco Rubio saying Iran is “not serious about talks.”
Implication: The conflict had shown signs of easing, but each new escalation, including the Houthi threat, adds fresh pressure to oil prices.
Oil Prices Rise as Middle East Conflict Escalates
#2 - US Treasury Yields Climb Higher
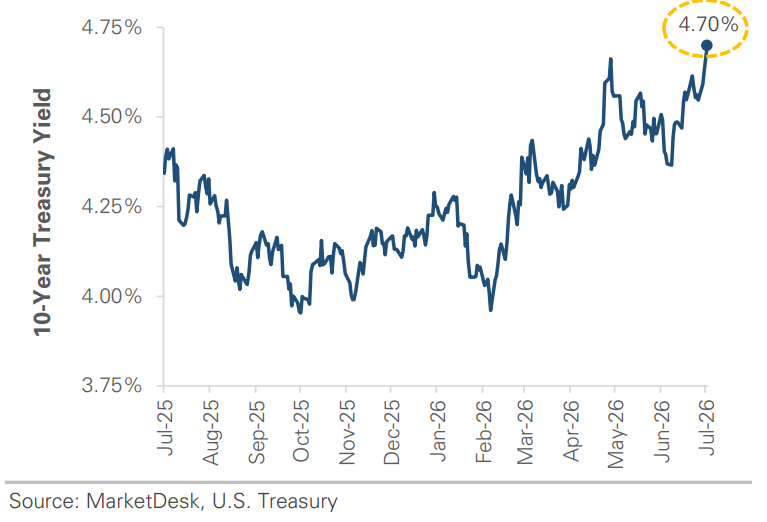
Rising oil pushed Treasury yields to fresh 52-week highs and revived bets on a Fed rate hike. This week's move in yields was a direct extension of the Middle East story above. The 10- year Treasury yield rose above 4.70%, a new 52-week high, as inflation concerns worked their way into the bond market. Fed funds futures now assign a greater than 80% probability to a rate hike at the Fed's September meeting, up from around 50% odds a week ago.
Implication: Treasury yields are tracking the Middle East conflict, underscoring how closely linked energy and interest rates have become.
10-Year Treasury Yield Sets New 52 Week High
#3 - Alphabet’s Spending Commitment
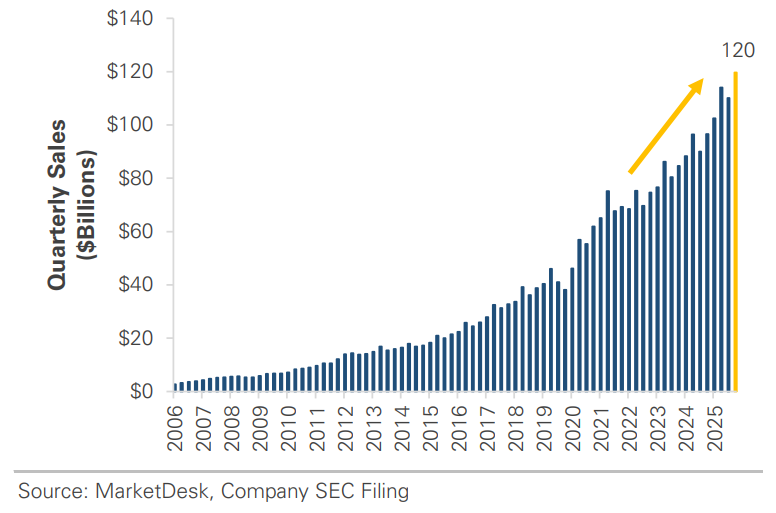
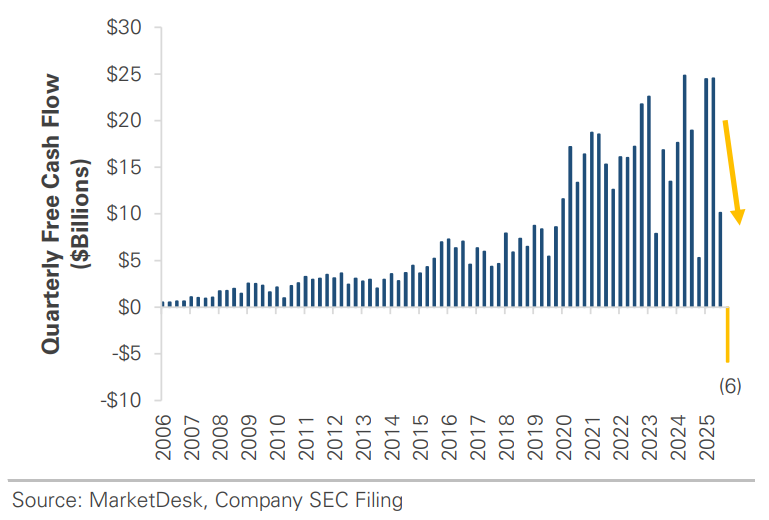
Alphabet’s strong quarter got overshadowed by an even bigger spending commitment. The company reported second-quarter results Wednesday that beat expectations across the board. Revenue rose +24% to $120 billion, Google Cloud revenue jumped +82%, and operating margins expanded. However, shares still declined about -5% in after-hours trading as investors worried about the spending driving that growth. The company raised its 2026 capital expenditure guidance to a range of $195 billion to $205 billion, up from $180 billion to $190 billion previously, and said spending would increase further in 2027. Quarterly free cash flow was negative for the first time in the company’s history, as capital spending outpaced the cash generated by the operating business.
Implication: The market is not questioning whether AI is driving growth; Alphabet's numbers say it is. The question is whether the growth is worth its price, with investors wanting evidence that the company can earn a positive return on its investment.
Alphabet Reports Strong Revenue Growth
Alphabet’s Free Cash Flow Turns Negative
#4 - Next Week’s Calendar
Next week’s calendar could answer many of the questions discussed above. The Fed’s two-day meeting concludes Wednesday, July 29, with a rate decision and press conference that will show whether officials are treating the energy-driven inflation pressure as a reason to alter policy and potentially raise interest rates. Microsoft and Meta report earnings the same day after the market closes, adding two more data points to the AI-spending debate. Thursday brings the Q2 GDP advance estimate and the June PCE index, the Fed’s preferred inflation gauge, with Apple and Amazon reporting earnings after the market closes.
Implication: Each item discussed above, including oil's effect on inflation, the return on AI capex investment, and the Fed’s next move, will be tested within a two-day window next week.
US Dollar Strengthens to a 1-Year High
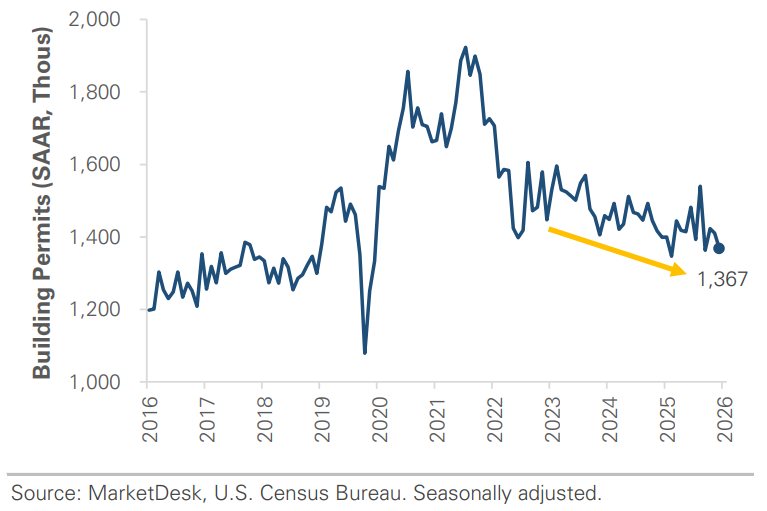
Building Permits Signal Weak Home Construction
Important Disclosures
This material is provided for general and educational purposes only and is not investment advice. Your investments should correspond to your financial needs, goals, and risk tolerance. Please consult an investment professional before making any investment or financial decisions or purchasing any financial, securities, or investment-related service or product, including any investment product or service described in these materials.
Our Insights