Inflation, Bank Earnings, and Consumer Spending

Photo Credit: Tom Briskey, Unsplash
Weekly Market Recap for July 17th
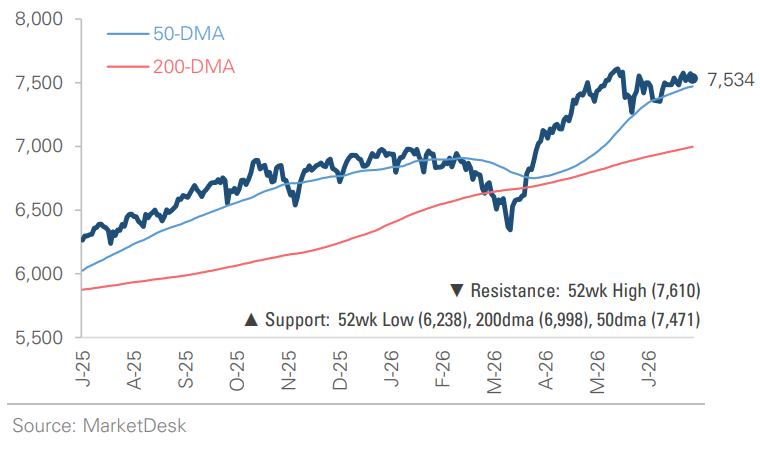
This week, the markets were mixed as leadership continued to rotate. The S&P 500 returned -0.1% and the Nasdaq declined -2.5% as investors rotated out of Technology stocks. The value and equal-weight factors both outperformed, an indication that the average stock traded higher even as the cap-weighted indexes declined. The high beta and momentum factors led the market lower due to their overweighting of the Tech sector, which fell 4.3%. Meanwhile, eight of the eleven S&P 500 sectors traded higher, led by Energy and Consumer Staples. Bonds mostly finished the week flat, with longer-dated Treasury bonds modestly underperforming as oil prices surged nearly +10% on renewed Middle East conflict. The VIX, a measure of expected market volatility, held steady. The U.S. dollar was little changed, and Bitcoin rose +1.0%.
S&P 500 Index (Last 12 Months)
S&P 500 Technical Composite (Last 24 Months)
US Risk Demand Market Indicator
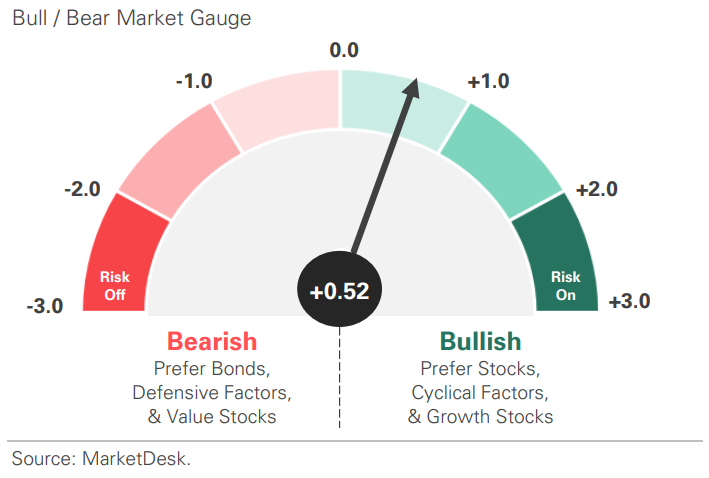
The US Risk Demand Indicator (USRDI) is a quantitative tool to measure real-time investor risk appetite. When the indicator is above zero, it signals a risk-on environment favoring cyclical sectors, high-beta stocks, high-yield corporate bonds, and hybrid (convertible) bonds. In contrast, a reading below zero signals a risk-off environment favoring defensive sectors, low-volatility stocks, and US Treasury bonds.
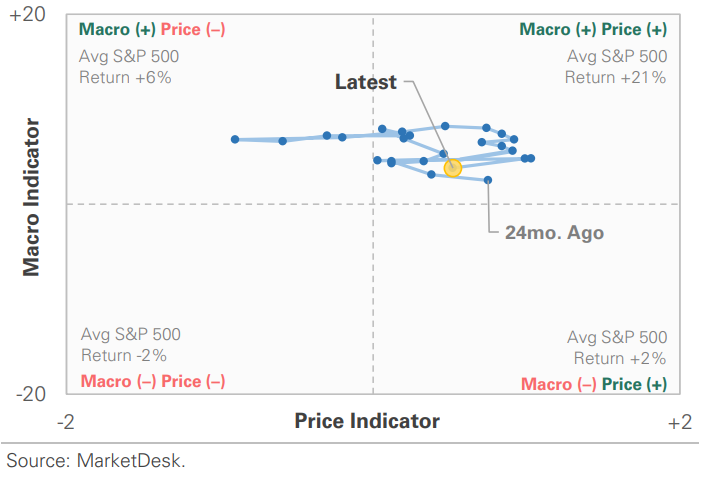
US Market Economic Cycle Indicator
The Market Cycle Indicator tracks two primary investor groups: macro investors and price-based investors. Macro investors rely on fundamental and economic data to guide their decisions, while price-based investors (or technical analysts) focus on price action, momentum, volume, and behavioral trends. The Indicator synthesizes these perspectives to identify the prevailing market regime.
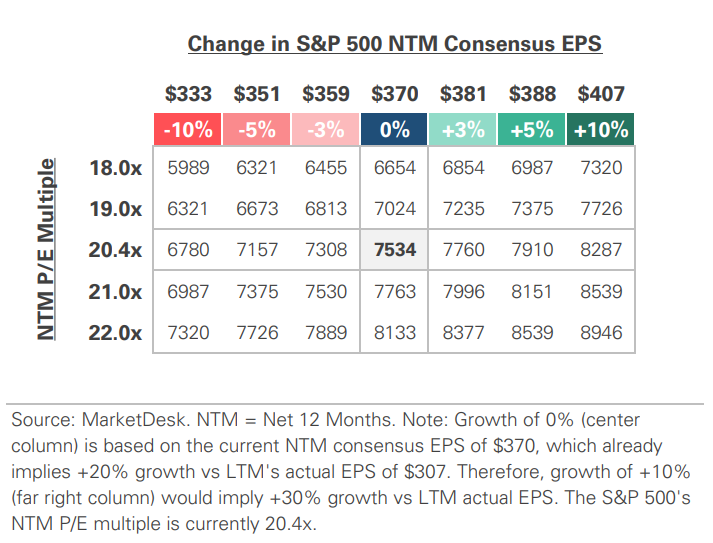
S&P 500 Valuation Matrix
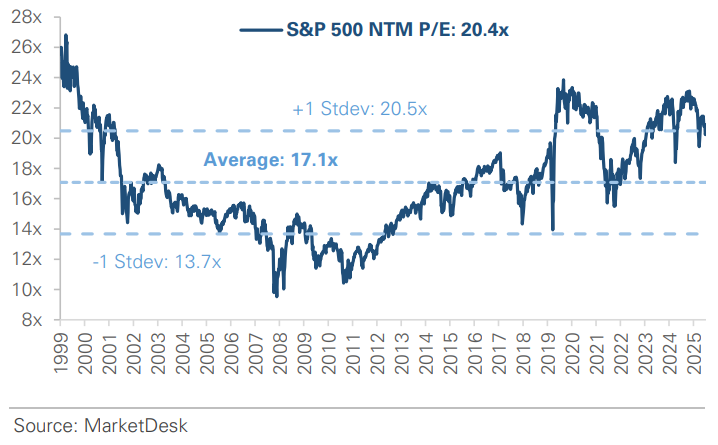
S&P 500 Forward PE Ratio
The S&P 500 forward price-to-earnings (P/E) ratio is a widely followed valuation metric that compares the index's current level to the projected earnings of its constituent companies over the next 12 months. The indicator implies to investors how much they are paying today for each dollar of expected future earnings.
Key Takeaways
#1 - Inflation Starts to Cool
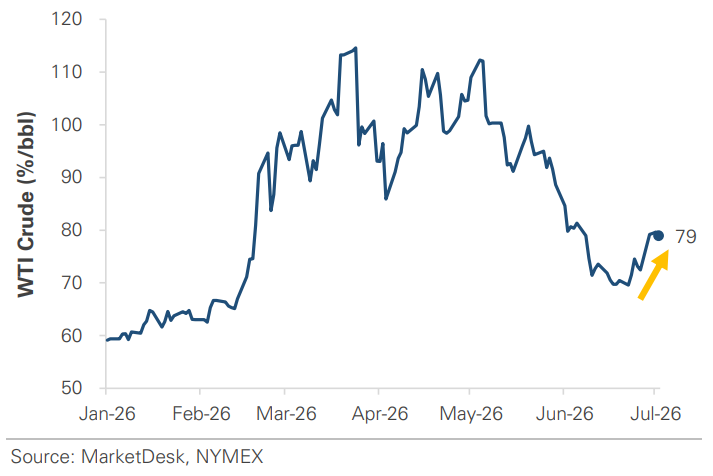
Inflation cooled sharply in June as energy prices fell. The Consumer Price Index, or CPI, declined by 0.4%, its largest monthly drop in more than six years, pulling the annual inflation rate down to 3.5% from 4.2% in May. Wholesale prices, which measure the prices producers receive for their products and services, eased as well. The declines in both trace back to energy, following a nearly -10% decline in gasoline prices. However, the relief reflects a period when oil prices were falling and lower than today. Since the start of July, the U.S.-Iran ceasefire has broken down, and crude has climbed back toward $80 a barrel after starting the month below $70.
Implication: June’s improvement is real, but it rests on lower energy costs that have already begun to reverse. With inflation still above the Fed’s 2% target and oil climbing again, the central bank has signaled it may need to raise interest rates.
Inflation Eased in June as Oil Prices Fell
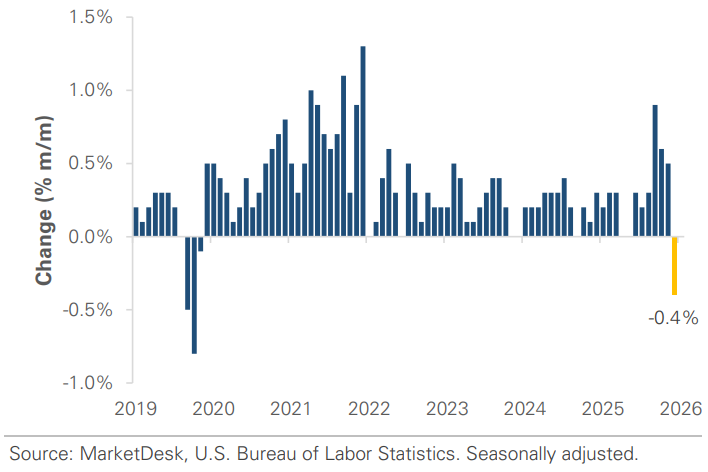
Rising Oil Prices Could Create New Pressures
#2 - Earnings Season Begins
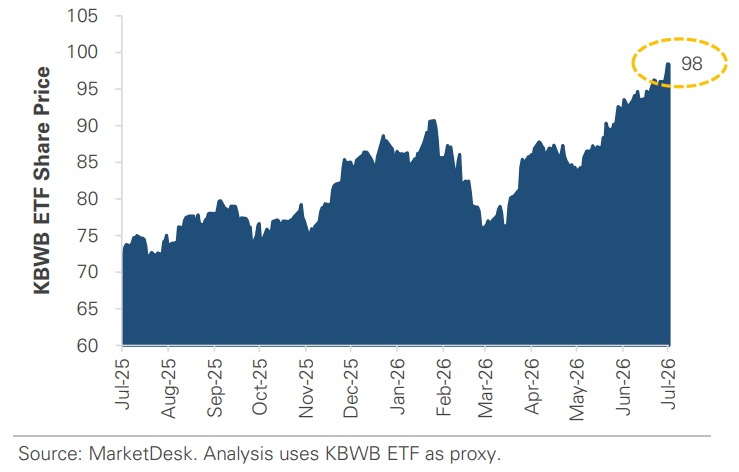
Wall Street banks opened Q2 earnings season with record results, fueled by a busy and volatile market. The banks earn fees when companies raise debt and equity, merge or go public, and when investors trade, and Q2 was a busy market environment for all three. A wave of dealmaking and a rush of IPOs, including the roughly $75 billion SpaceX debut, drove a surge in investment banking fees, while choppy markets tied to the Middle East conflict and the AI boom lifted trading revenue. Financing tied to AI added to activity, as companies raised debt and equity to fund data center buildouts. Goldman Sachs posted the best quarter in its history, and JPMorgan Chase, the nation’s largest bank, grew its earnings by more than +40% from a year earlier.
Implication: The same active, volatile market that unsettled the market and economy in Q2 worked in the banks’ favor, since their fee and trading income rises when companies and investors are busy.
Banks Set New Highs After Reporting Strong Earnings
#3 - Broader Market Held Steady
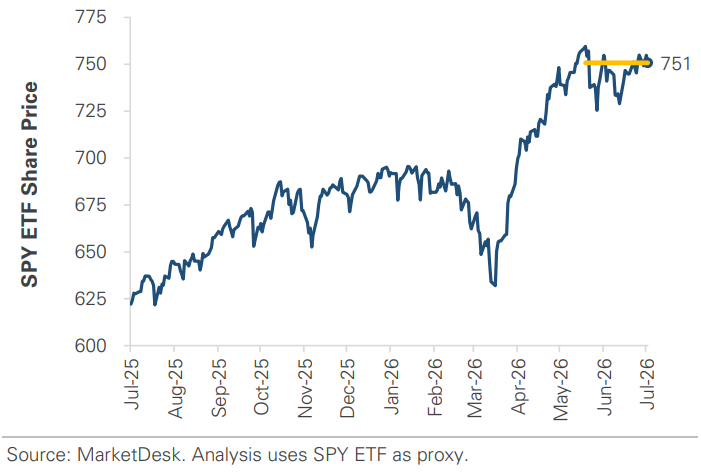
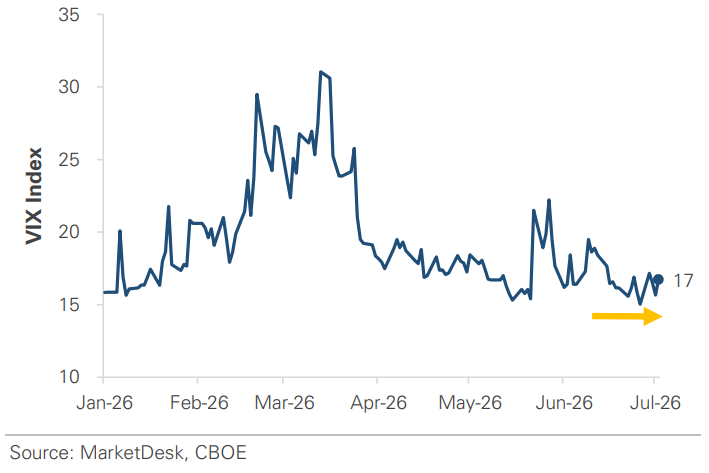
The broader market has held steady even as semiconductor stocks turn volatile. Semiconductor stocks continue to swing sharply day to day, driven by questions about the AI buildout, but the headline index has been less volatile. The reason is rotation: as investors step back from chips, they have moved into other areas such as financials and industrials - the S&P 500 trades within 1% of its early-June record, with few signs of stress. The VIX, a measure of expected volatility, sits in the mid-teens, and credit markets remain calm, with credit spreads still extremely tight.
Implication: This year’s hottest trade has become more volatile, but it has not weighed on the broader index. Other corners of the market have started to work, offsetting the weakness in chips, so a volatile pocket has not triggered broader market volatility.
SP 500 Trades Less Than 1% Below All-Time High
VIX Index Remains in the Mid-Teens
#4 - Consumer Spending Holds Up
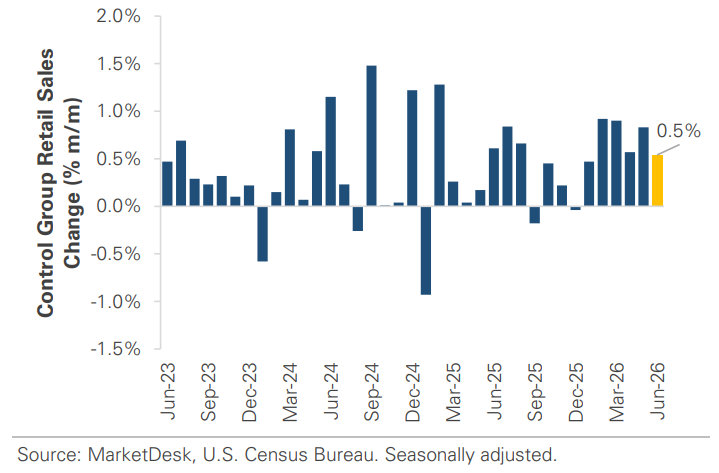
Consumer spending held up in June, even as the pace of spending moderated. Retail sales rose +0.2% for the month, down from a revised +1.0% in May but in line with expectations. Much of the slowdown came from cheaper gasoline, which pulled down receipts at gas stations, the same drop in energy that eased inflation. Excluding gas, sales rose 0.7% as shoppers took advantage of online deals during Amazon’s Prime Day.
Implication: Consumer spending drives most of the economy, and June's report shows it holding up rather than stalling once the effect of cheaper gas is set aside.
Consumer Spending Continued to Grow in June
Important Disclosures
This material is provided for general and educational purposes only and is not investment advice. Your investments should correspond to your financial needs, goals, and risk tolerance. Please consult an investment professional before making any investment or financial decisions or purchasing any financial, securities, or investment-related service or product, including any investment product or service described in these materials.
Our Insights