Oil Prices Reverse Higher, June Fed Meeting Minutes, and Semiconductors

Photo Credit: Federal Reserve, Flickr
Weekly Market Recap for July 10th
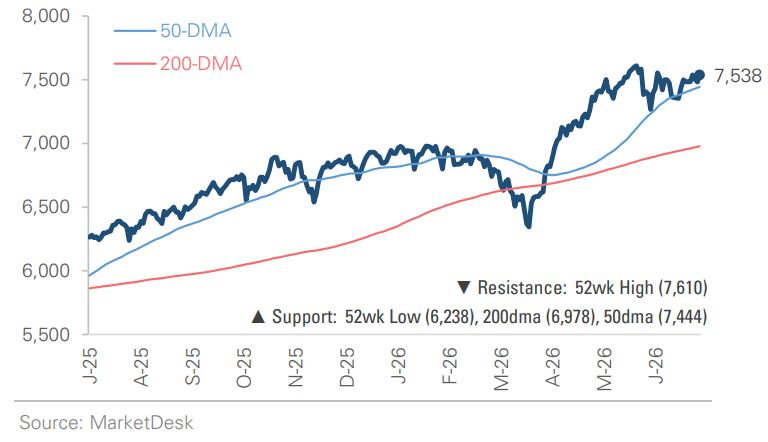
This week, the markets traded higher with leadership swinging back to the largest tech stocks. The S&P 500 gained +0.7%, and the Nasdaq returned +1.5%, while the Russell 2000 small-cap index finished flat. Growth and momentum strategies outperformed, while value and equal-weight lagged, an indication that the average stock traded lower. Beneath the surface, breadth was narrow: only Energy and Tech posted meaningful gains, while eight of the eleven S&P 500 sectors declined. Bonds traded lower as Treasury yields rose on the oil spike and the Fed’s June minutes, with longer-dated bonds underperforming due to their sensitivity to interest rate movements. Oil prices rose more than +4%, the U.S. dollar held steady, and Bitcoin rose nearly +1%.
S&P 500 Index (Last 12 Months)
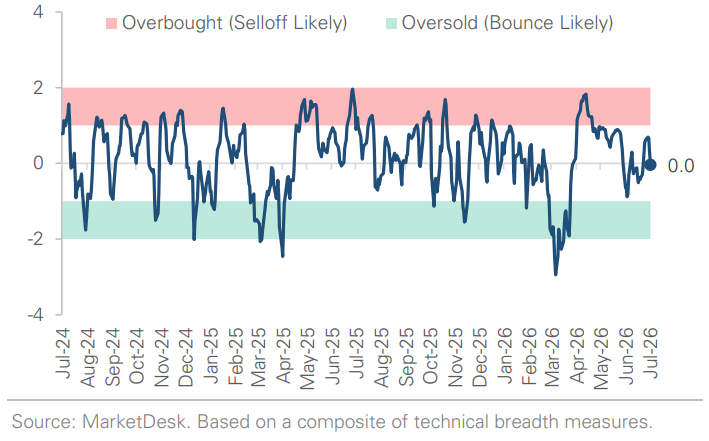
S&P 500 Technical Composite (Last 24 Months)
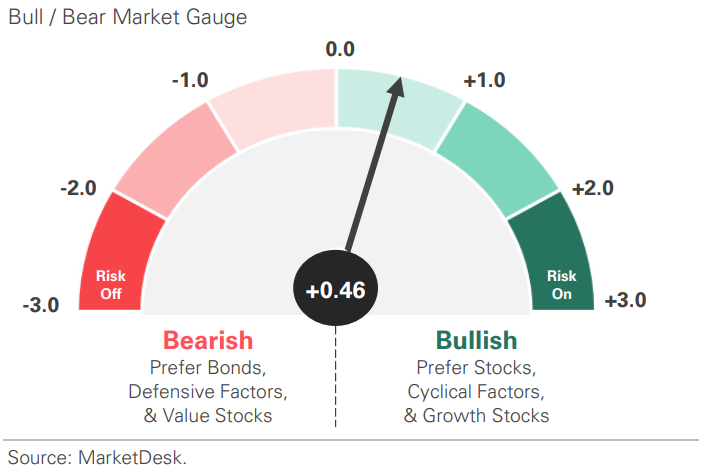
US Risk Demand Market Indicator
The US Risk Demand Indicator (USRDI) is a quantitative tool to measure real-time investor risk appetite. When the indicator is above zero, it signals a risk-on environment favoring cyclical sectors, high-beta stocks, high-yield corporate bonds, and hybrid (convertible) bonds. In contrast, a reading below zero signals a risk-off environment favoring defensive sectors, low-volatility stocks, and US Treasury bonds.
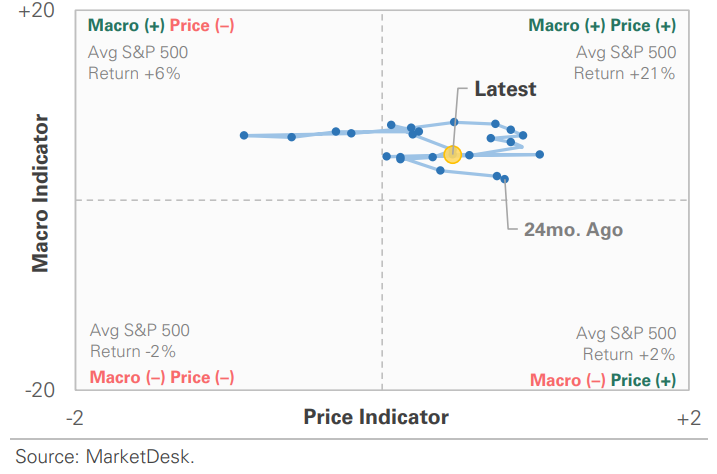
US Market Economic Cycle Indicator
The Market Cycle Indicator tracks two primary investor groups: macro investors and price-based investors. Macro investors rely on fundamental and economic data to guide their decisions, while price-based investors (or technical analysts) focus on price action, momentum, volume, and behavioral trends. The Indicator synthesizes these perspectives to identify the prevailing market regime.
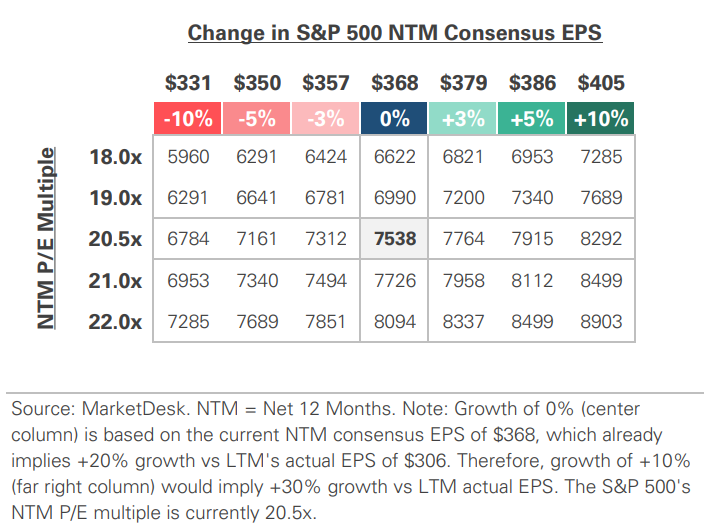
S&P 500 Valuation Matrix
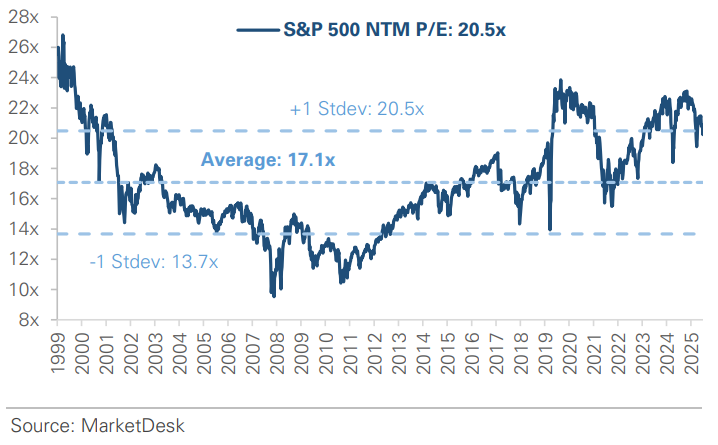
S&P 500 Forward PE Ratio
The S&P 500 forward price-to-earnings (P/E) ratio is a widely followed valuation metric that compares the index's current level to the projected earnings of its constituent companies over the next 12 months. The indicator implies to investors how much they are paying today for each dollar of expected future earnings.
Key Takeaways
#1 - Oil Prices Rise
Oil prices rose this week as the U.S.-Iran ceasefire gave way to renewed conflict. After round-tripping back to $70 a barrel during Q2, crude reversed course and rose this week. West Texas Intermediate rose more than +4% to $73, and Brent, the international benchmark, rose +5% to $78, after the U.S. struck Iran and the White House said the ceasefire was over. The move followed renewed disruptions in the Strait of Hormuz, the waterway that carries a large share of the world’s oil, after Iran attacked passing vessels. Prices steadied late in the week as traders reassessed the supply impact.
Implication: Energy prices had retraced their spring spike, and this week’s move puts oil back at the center of the inflation picture after weeks of relief.
#2 - Fed Reserve Divided
The Federal Reserve’s June minutes revealed a divided committee. Minutes from the meeting, released Wednesday, showed Federal Reserve officials were split over whether their next move should be a cut or a hike. Some made the case for higher rates, citing inflation risks from the Middle East conflict, tariffs, and AI spending, while others saw a cooling job market as a reason to lower interest rates. The committee left its benchmark rate unchanged in a range of 3.50% to 3.75%, where it has held all year, and it meets later this month.
Implication: The Fed had been cutting rates before pausing this year, and the divide suggests it is likely to hold steady again this month, though there are forecasts for the Fed to hike later this year.
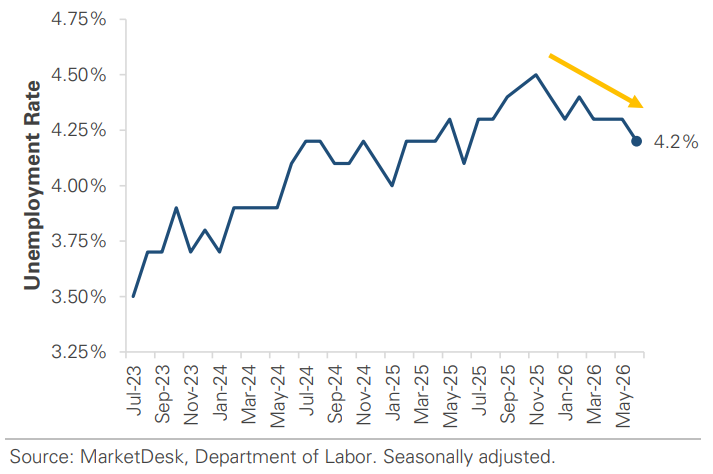
Unemployment Falls to 4.2%
#3 - Job Growth Slows
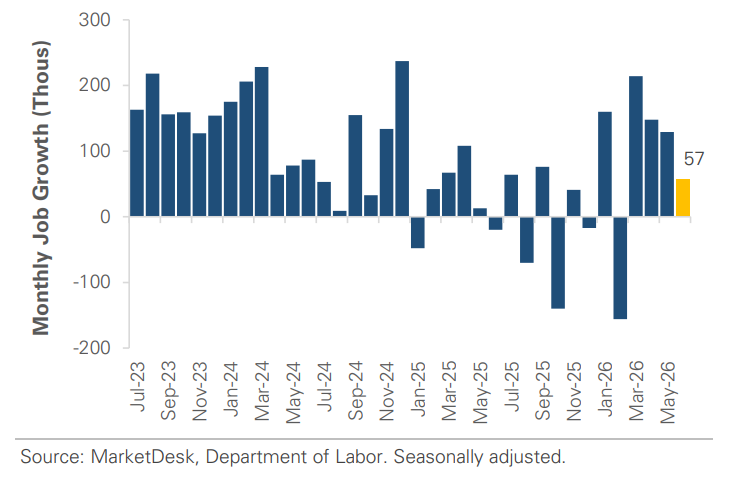
Job growth slowed to its weakest pace in four months in June. Employers added +57,000 jobs, below the +115,000 economists expected, and figures for April and May were revised down by a combined -74,000. Despite the June slowdown, labor conditions have improved this year. Hiring averaged +92,000 a month over the first half of 2026, a clear improvement from the roughly -7,000 jobs lost each month in the second half of last year. In addition, the unemployment rate has declined to 4.2% after peaking at 4.5% in Q4 last year.
Implication: The jobs report suggests the labor market is stabilizing after softening in the second half of 2025.
Monthly Job Growth Cools in June
#4 - Strong First Half of Year for Stocks
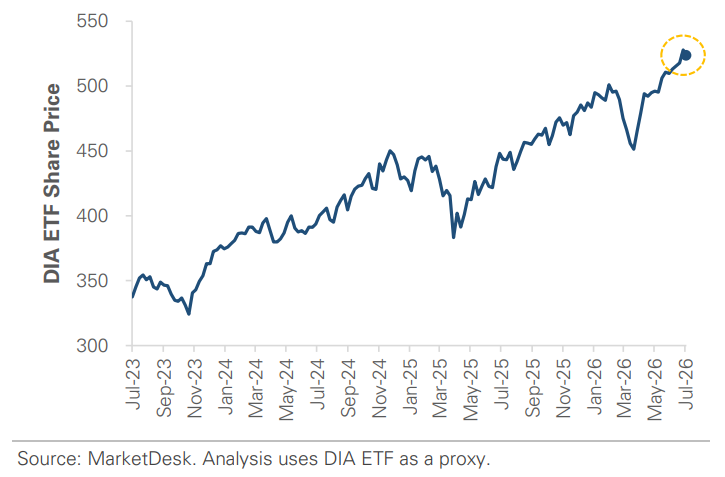
Stocks closed out a strong first half at record highs, even after a late pullback. The Dow Jones Industrial Average gained nearly +10%, its best start since 2021, and crossed 53,000 for the first time. The S&P 500 advanced +10.2%, and the tech-heavy Nasdaq 100 gained +20% as tech stocks returned more than +30%. The Russell 2000 small-cap index rose nearly +22%, its best first half since 1991.
Implication: Consumer spending drives most of the economy, and June’s report shows it holding up rather than stalling once the effect of cheaper gas is set aside.
Dow Jones Index Sets New All-Time High
#5 - Continued Volatility in Semiconductor Stocks
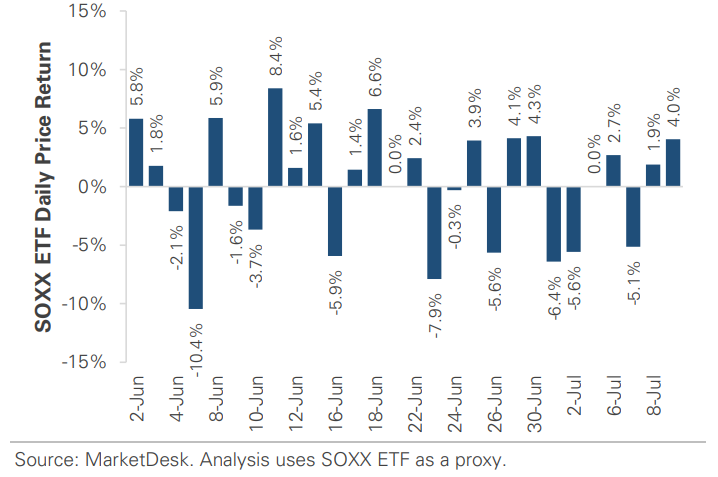
Semiconductor stocks have been volatile in recent weeks after gaining nearly +80% in the first half. The group carries high expectations, which can make it quick to react to news and shifts in sentiment. South Korea’s Samsung reported record profit that beat estimates but fell short of the market’s elevated AI expectations, triggering a semiconductor selloff on valuation concerns. Renewed questions about how much the largest tech companies are spending on AI infrastructure and whether that pace can hold added to the swings.
Implication – The semiconductor trade has become popular and leveraged, which can magnify the moves in both directions. The group makes up a large share of the major indexes, so its swings tend to pull the broader market along.
Semiconductor Stocks Remain Volatile
Important Disclosures
This material is provided for general and educational purposes only and is not investment advice. Your investments should correspond to your financial needs, goals, and risk tolerance. Please consult an investment professional before making any investment or financial decisions or purchasing any financial, securities, or investment-related service or product, including any investment product or service described in these materials.
Our Insights