
Semiconductor Stock Volatility, Inflation Data, and Energy Prices

Photo Credit: Vishnu Mohanan, Unsplash
Weekly Market Recap for June 26th
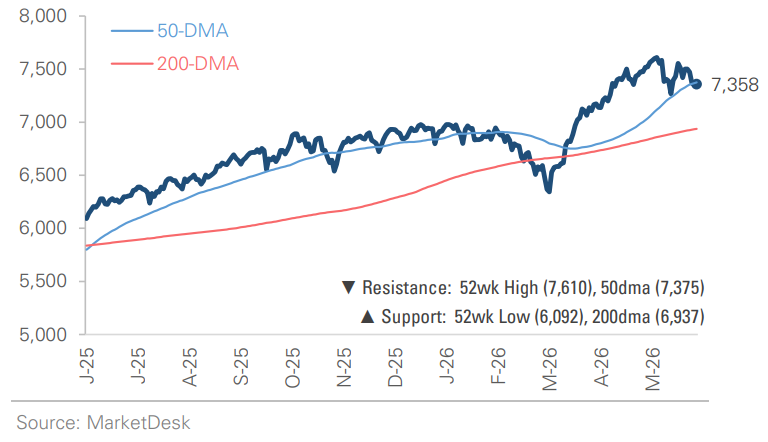
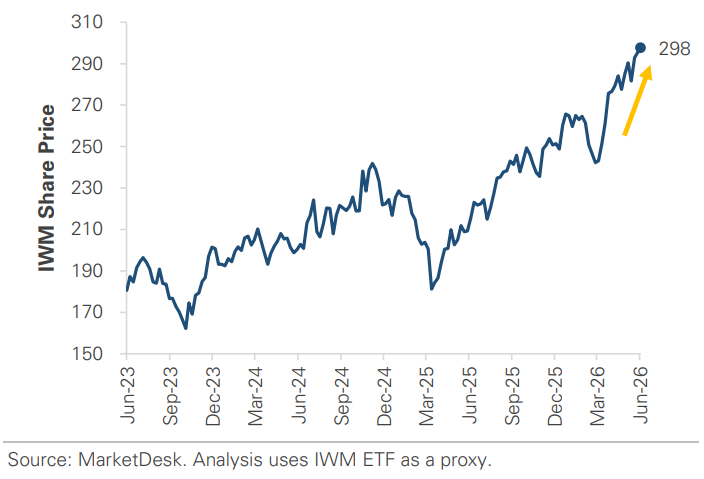
This week, markets traded lower, though there was relative strength beneath the major equity indexes. The S&P 500 and Nasdaq both ended the week lower as the largest tech stocks sold off, while the Russell 2000 small-cap index, along with the value and equal-weight factors, produced modest gains. Technology, Communication Services, and Consumer Discretionary were the worst-performing sectors as mega-cap stocks like Apple and Microsoft traded lower. The eight remaining sectors finished higher, led by defensive areas of the market. Bonds gained as Treasury yields fell despite a hot inflation report, with investors expecting inflation to ease after the recent decline in oil prices. Oil fell nearly -5% as traffic in the Strait increased, while the VIX, a measure of expected market volatility, drifted higher as the major indexes declined.
S&P 500 Index (Last 12 Months)
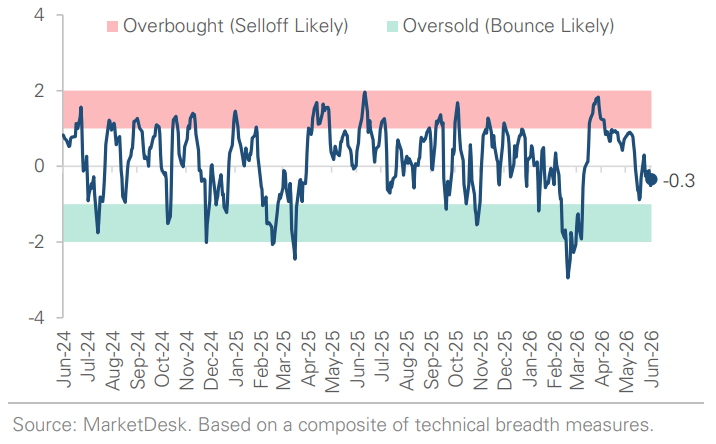
S&P 500 Technical Composite (Last 24 Months)
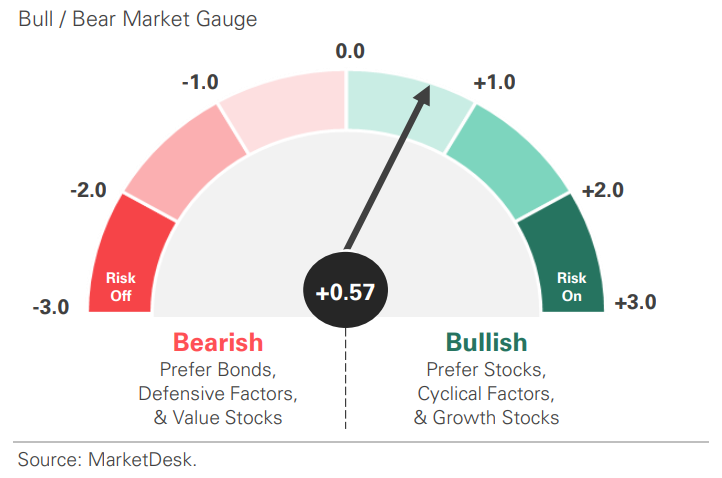
US Risk Demand Market Indicator
The US Risk Demand Indicator (USRDI) is a quantitative tool to measure real-time investor risk appetite. When the indicator is above zero, it signals a risk-on environment favoring cyclical sectors, high-beta stocks, high-yield corporate bonds, and hybrid (convertible) bonds. In contrast, a reading below zero signals a risk-off environment favoring defensive sectors, low-volatility stocks, and US Treasury bonds.
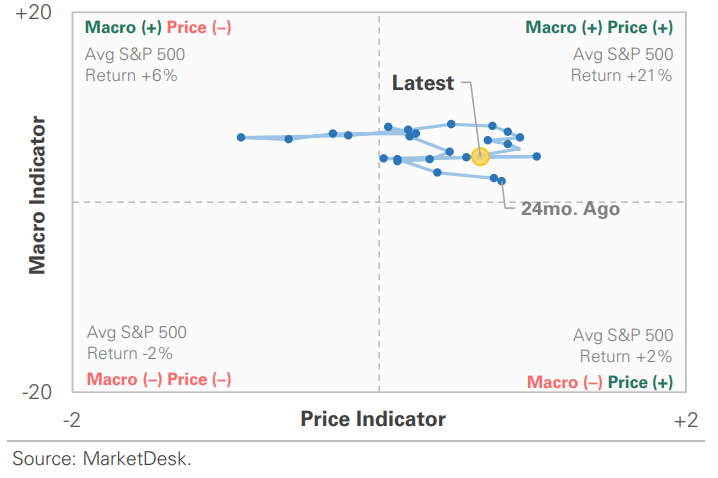
US Market Economic Cycle Indicator
The Market Cycle Indicator tracks two primary investor groups: macro investors and price-based investors. Macro investors rely on fundamental and economic data to guide their decisions, while price-based investors (or technical analysts) focus on price action, momentum, volume, and behavioral trends. The Indicator synthesizes these perspectives to identify the prevailing market regime.
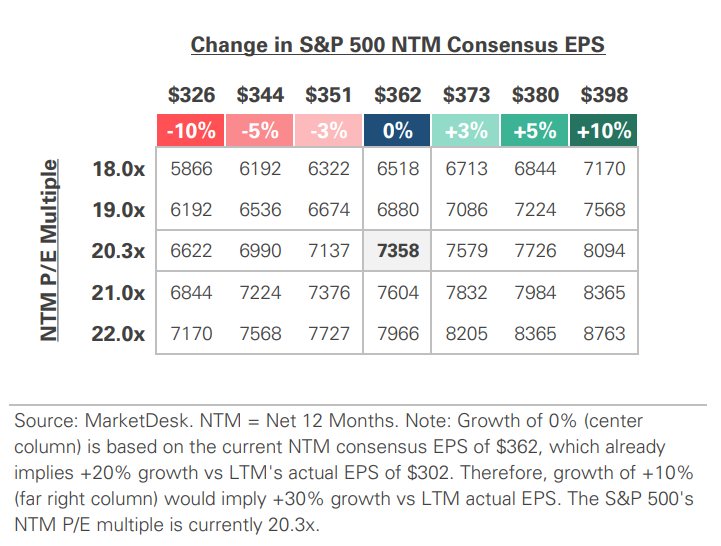
S&P 500 Valuation Matrix
S&P 500 Forward PE Ratio
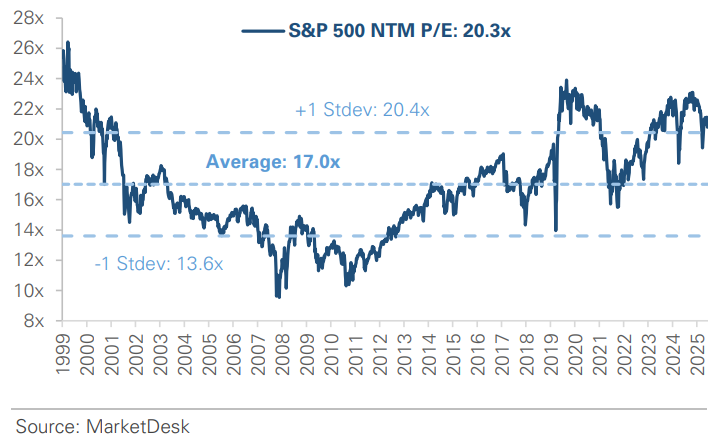
The S&P 500 forward price-to-earnings (P/E) ratio is a widely followed valuation metric that compares the index's current level to the projected earnings of its constituent companies over the next 12 months. The indicator implies to investors how much they are paying today for each dollar of expected future earnings.
Key Takeaways
#1 - Semiconductor Stocks
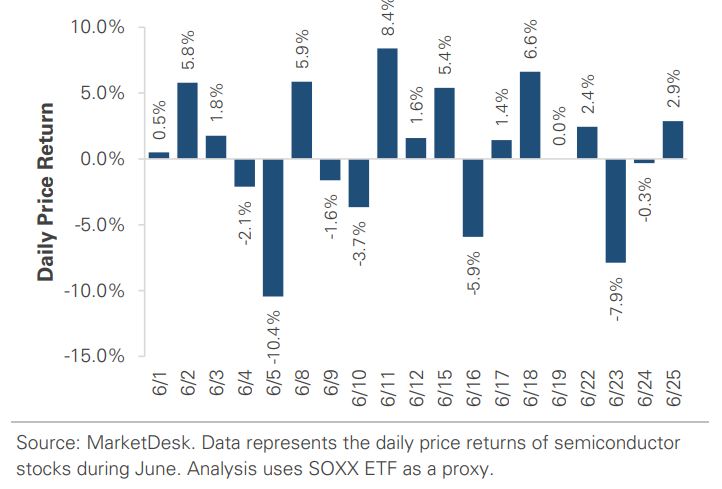
Semiconductor stocks, one of this year’s most crowded trades, remain volatile. The group sold off sharply on Monday and Tuesday as investors unwound leverage that had built up in the industry. Semiconductors have significantly outperformed the broader market this year, but the popularity cuts both ways: when sentiment turns, moves are large in either direction. As an example, the mood shifted again Wednesday evening, when Micron, a leading memory-chip maker, reported record quarterly revenue. Its shares jumped more than +15% overnight into Thursday morning.
Implication: AI infrastructure spending is the engine driving semiconductor companies’ profits and share price gains, and the industry has benefited from hundreds of billions in capex. The trade has become popular and heavily leveraged, which is why it has become so volatile.
Semiconductor Stocks Remain Volatile
Small Cap Stocks Trade Near All-Time Highs
#2 - Inflation Data Runs Hot
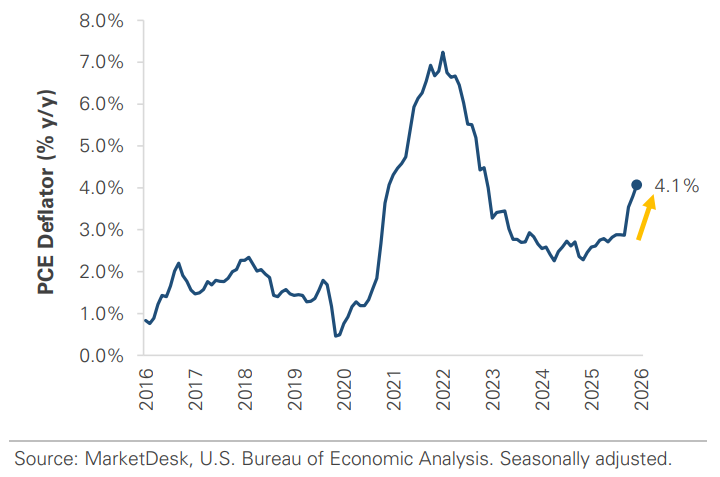
Inflation data runs hot after an oil price spike. The Federal Reserve’s preferred inflation gauge rose to +4.1% year-over-year in May, the highest reading in nearly three years. Higher energy prices tied to the Middle East conflict were the main driver, but many economists believe May could mark the peak before inflation eases over the summer. Despite those projections, the Fed has shifted its policy stance because inflation remains above its 2% target. After signaling earlier this year that rate cuts were likely, officials have taken cuts off the table for 2026, and markets now see a possible rate hike later this year.
Implication: The takeaway is that the Fed’s rate-cutting cycle could remain on pause. With the Fed now prioritizing inflation over growth and the labor market, rates could remain elevated and potentially move higher before coming down.
Oil Price Spike Pushes Inflation to a 3-Year High
#3 - Energy Prices Come Down
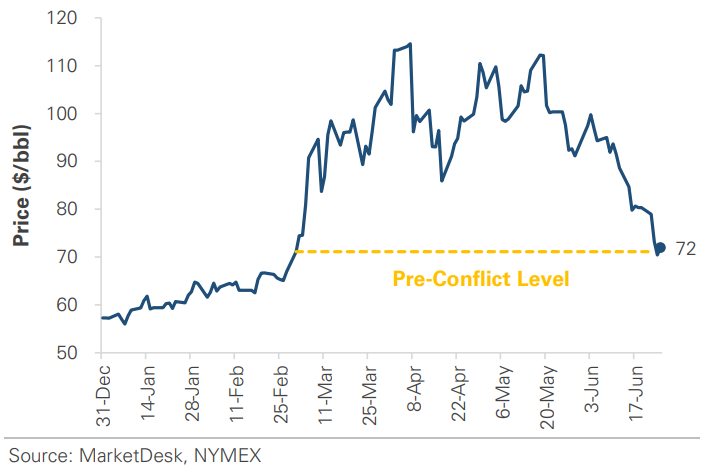
Energy prices have returned to pre-conflict levels as the Strait reopens. Oil prices have now given back the entire spike tied to the Middle East conflict. U.S. crude fell to around $70 a barrel this week, its lowest since the conflict began in late February, as oil tankers resume moving through the Strait of Hormuz and shipping starts to normalize.
Implication: Lower energy prices ease pressure on household budgets. It is also the primary reason inflation is expected to cool in the months ahead, since the same energy spike that pushed inflation to a three-year high is now reversing.
Oil Falls to Pre-Conflict Levels as Strait Reopens
#4 - Q1 2026 GDP Growth
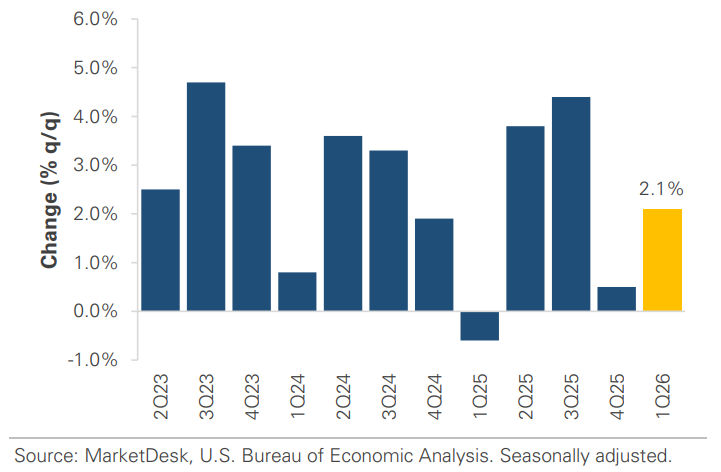
Q1 2026 GDP growth was revised higher. The government’s final look at first-quarter economic growth came in at +2.1%, up from an earlier estimate of +1.6%. The figure covers January through March, which predates most of the energy shock from the conflict and reflects where the economy stood earlier in the year.
Implication: The economy entered 2026 on a firmer footing than previously estimated, an encouraging data point, even though it reflects activity before the oil supply disruption.
Q1 2026 GDP Revised Higher
#5 - Business Investment Remains Strong
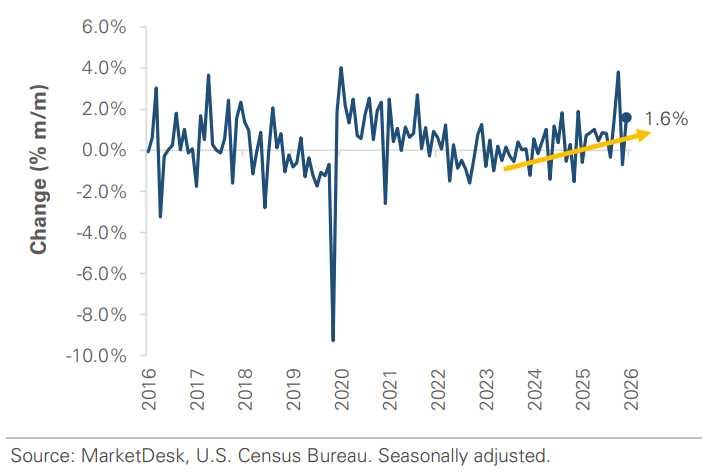
Business investment remained strong in May. Orders for long-lasting manufactured goods fell -4.5% in May, but nearly all of the decline came from a drop in volatile aircraft orders following an unusually strong April. A measure of broad business investment, which excludes aircraft orders and defense spending, rose by more than expected.
Implication: The headline looks worse than the reality. Underneath the noise, businesses continued to invest, a quietly encouraging sign for the economy and for corporate profits.
Core Durable Goods Orders Remain Strong
Important Disclosures
This material is provided for general and educational purposes only and is not investment advice. Your investments should correspond to your financial needs, goals, and risk tolerance. Please consult an investment professional before making any investment or financial decisions or purchasing any financial, securities, or investment-related service or product, including any investment product or service described in these materials.
Our Insights