Geopolitical Update, Job Growth, Consumer Spending, Inflation Data, and Next Week's Fed Meeting

Photo Credit: Mateusz Suski, Unsplash
Weekly Market Recap for March 13th
This week, markets finished lower as an early-week rally faded into a late-week selloff. Stocks initially rallied as the White House said the “war is very complete, pretty much,” and oil prices plunged, but the strength reversed as geopolitical tensions escalated and oil rebounded. The S&P 500 fell -2%, with Energy the only sector in positive territory. The Nasdaq outperformed with a -1.5% return as investors rotated toward tech stocks and mega caps amid the volatility, while the Russell 2000 returned -3%. Bonds traded lower as rising oil prices and inflation concerns pushed Treasury yields higher. Commodities were mixed: oil rebounded toward $100 per barrel as the Strait of Hormuz remained closed, while gold posted a modest loss despite the market volatility. The VIX Index fell below 30 as oil stabilized, but remains elevated amid unresolved tensions.
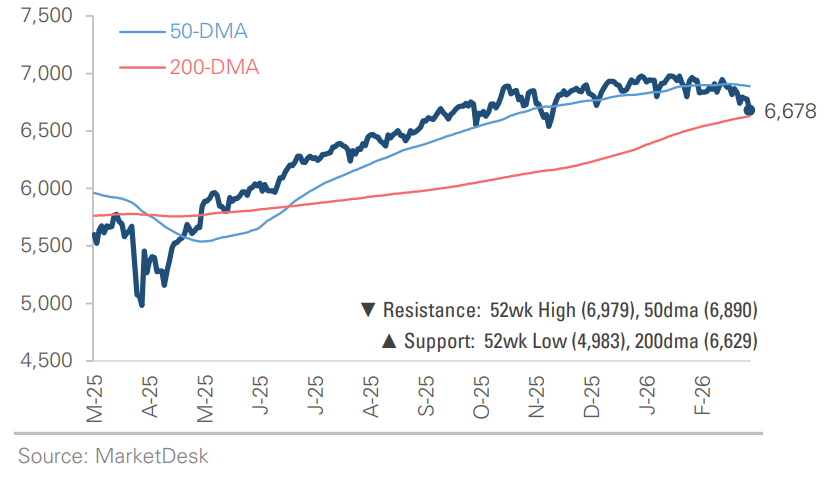
S&P 500 Index (Last 12 Months)
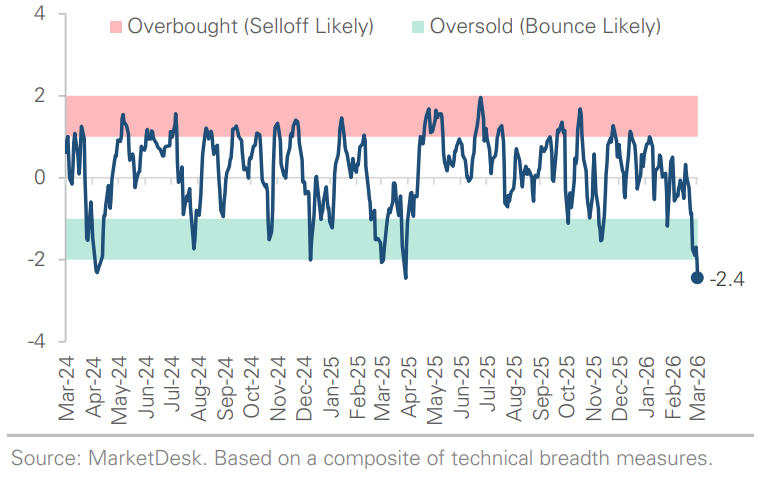
S&P 500 Technical Composite (Last 24 Months)
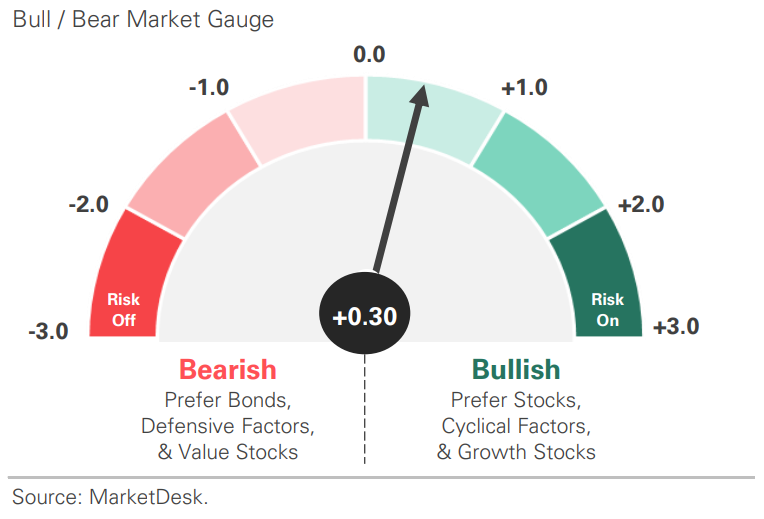
US Risk Demand Market Indicator
The US Risk Demand Indicator (USRDI) is a quantitative tool to measure real-time investor risk appetite. When the indicator is above zero, it signals a risk-on environment favoring cyclical sectors, high beta stocks, high-yield corporate bonds, and hybrid (convertible) bonds. In contrast, a reading below zero signals a risk-off environment favoring defensive sectors, low-volatility stocks, and US Treasury bonds.
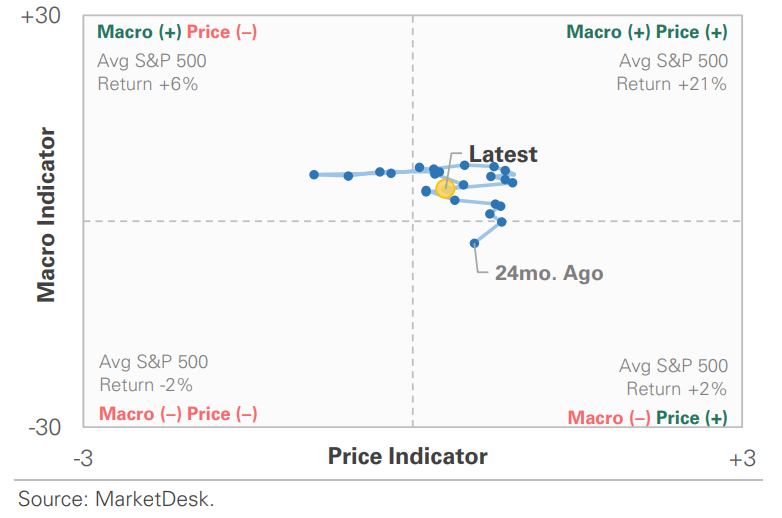
US Market Economic Cycle Indicator
The Market Cycle Indicator tracks two primary investor groups: macro investors and price-based investors. Macro investors rely on fundamental and economic data to guide their decisions, while price-based investors (or technical analysts) focus on price action, momentum, volume, and behavioral trends. The Indicator synthesizes these perspectives to identify the prevailing market regime.
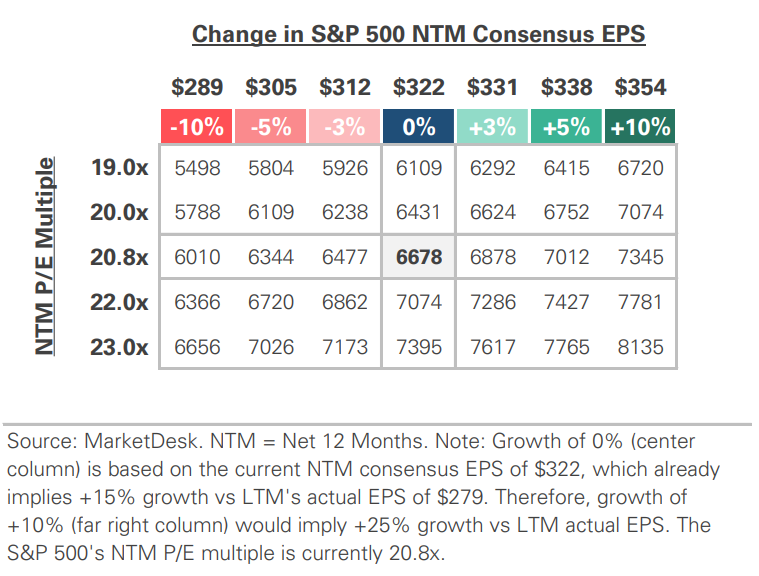
S&P 500 Valuation Matrix
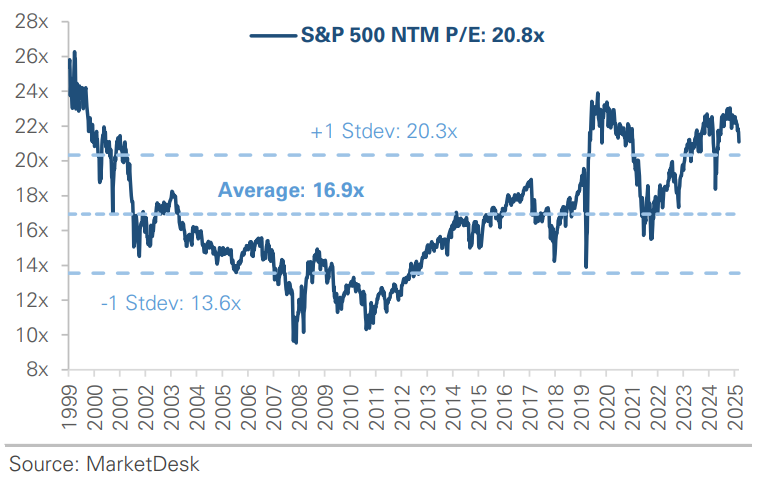
S&P 500 Forward PE Ratio
The S&P 500 forward price-to-earnings (P/E) ratio is a widely followed valuation metric that compares the index's current level to the projected earnings of its constituent companies over the next 12 months. The indicator implies to investors how much they are paying today for each dollar of expected future earnings.
Key Takeaways
#1 - Conflict in the Middle East
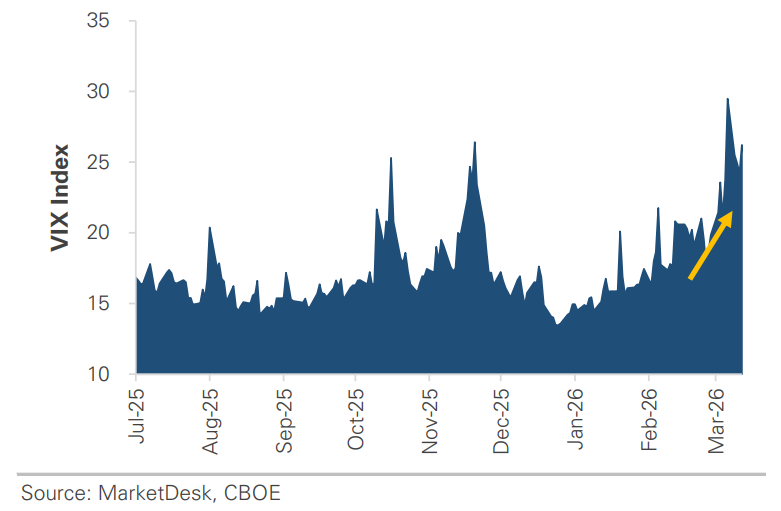
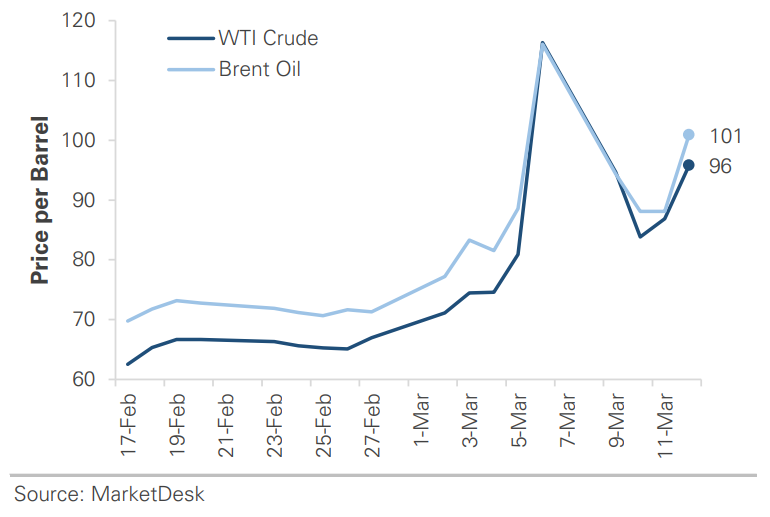
The conflict in the Middle East is entering its 12th day and continues to impact markets. The Strait of Hormuz remains effectively closed, and the energy shock remains the dominant market story. Oil has surged roughly 40% since the strike, the VIX spiked to an 11-month high before partially recovering, and Fed rate-cut expectations for 2026 have dropped from three to one. Equity markets have held up better than expected, with the S&P 500 down less than 3% since February 28. The key question is how quickly oil flows normalize, which will determine whether the supply disruption is contained or becomes a drag on economic growth.
Implication: Markets are likely to remain volatile until geopolitical tensions ease.
Market Volatility Remains Elevated
Oil Remains Volatile Due to Geopolitical Tensions
#2 - U.S. Economy Loses Jobs in February
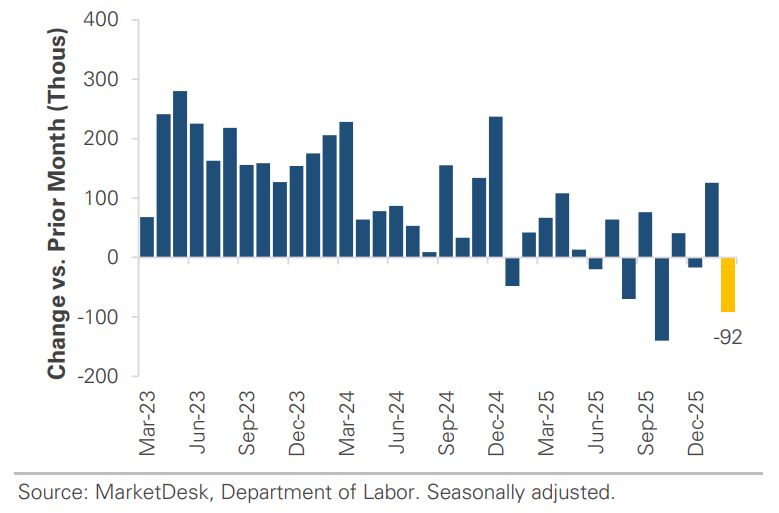
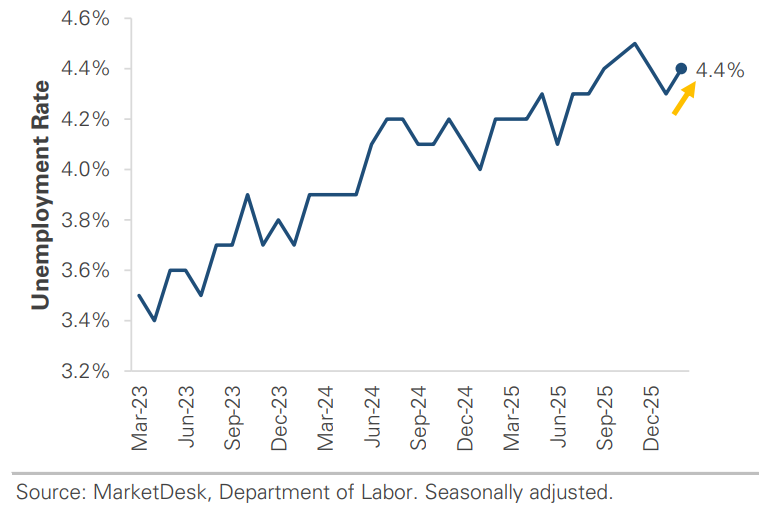
The U.S. economy lost -92,000 jobs in February, below expectations for +50,000–60,000. Prior months were also revised lower, with December flipping from +48,000 to -17,000, meaning the labor market has shed jobs in three of the past five months. Unemployment edged up to 4.4% from 4.3%. Part of the weakness was due to a Kaiser Permanente strike that kept ~31,000 healthcare workers off payrolls during the survey period, though it has since been resolved.
Implication: Labor market conditions increase pressure on the Fed to resume cutting rates, though the timing remains uncertain heading into the March 17–18 meeting. While some of the weakness reflects temporary distortions, the broader trend points to a softening labor market.
Job Growth Turned Negative in February
#3 - January Retail Sales Decline
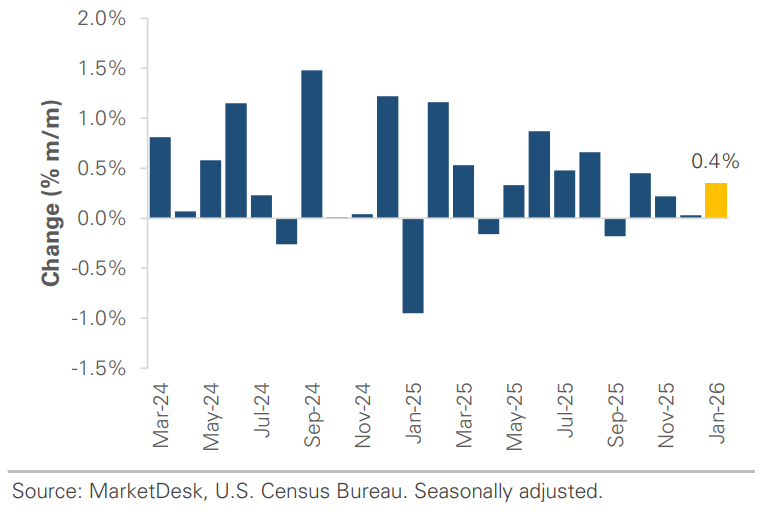
The January retail sales report showed a modest -0.2% m/m decline, below expectations for a flat reading. Weakness in motor vehicles and gasoline stations pulled the headline lower, though reduced gas spending largely reflected lower January fuel prices rather than weaker demand. Stripping out those categories, sales rose +0.3%, and the control group, which feeds directly into GDP calculations, also gained +0.3%, suggesting underlying consumer spending was more resilient than the headline implied.
Implication: The underlying consumer picture in January was stronger than the headline suggested. However, the recent oil shock introduces a new variable that could weigh on consumer spending in the months ahead.
Control Group Retail Sales Rise +0.4% Month over Month
#4 -Inflation Data Meets Expectations
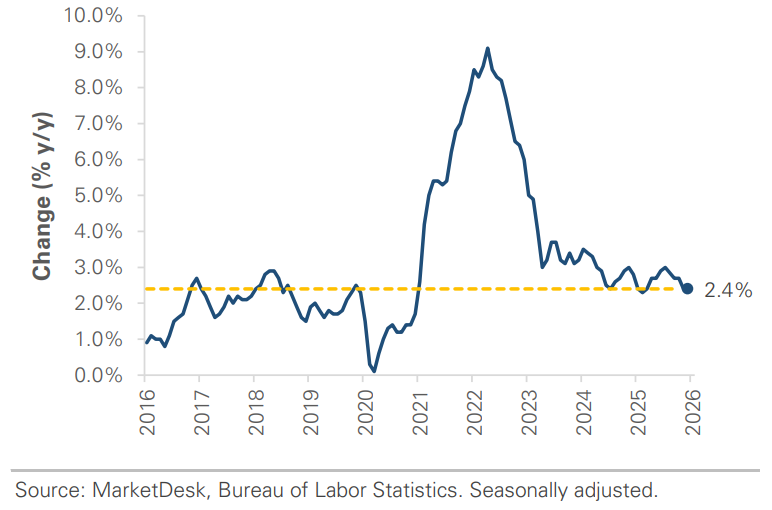
Inflation data came in line with expectations last month. Headline CPI rose +0.3% m/m and +2.4% y/y, in line with January. Core inflation, which excludes the volatile food and energy categories, rose +0.2% m/m and +2.5% y/y. Shelter costs, which have been the most stubborn component of inflation, continued to ease, with rent posting its smallest monthly gain since January 2021. The data suggests inflation continued to ease early in 2026.
Implication: February’s data is encouraging, but it was collected before the oil shock. Looking ahead, the question is whether the rise in oil prices will impact inflation and complicate Fed policy.
Inflation Was Easing Before Oil Prices Spiked
#5 - Fed Meeting Next Week
The Fed’s meeting is the big event next week. Investors expect the Fed to hold rates steady at 3.50–3.75%. The focus will shift to the updated dot plot, which will signal how many cuts policymakers expect in 2026 and whether higher oil prices are influencing their inflation outlook. The Fed faces a difficult balancing act: inflation is stabilizing, and the labor market is softening, but rising oil prices introduce a new inflation risk. The market expects one 0.25% rate cut this year, though two cuts are possible if energy stabilizes.
Implication: Until the oil shock’s impact on inflation becomes clearer, the Fed is unlikely to provide the policy clarity markets want.
Unemployment Rises to 4.4%
Important Disclosures
This material is provided for general and educational purposes only and is not investment advice. Your investments should correspond to your financial needs, goals, and risk tolerance. Please consult an investment professional before making any investment or financial decisions or purchasing any financial, securities, or investment-related service or product, including any investment product or service described in these materials.
Our Insights