Energy Infrastructure, Inflation Pressures, Fed Policy, Market Volatility, and AI Demand
Photo Credit: Getty Images, Unsplash
Weekly Market Recap for March 20th
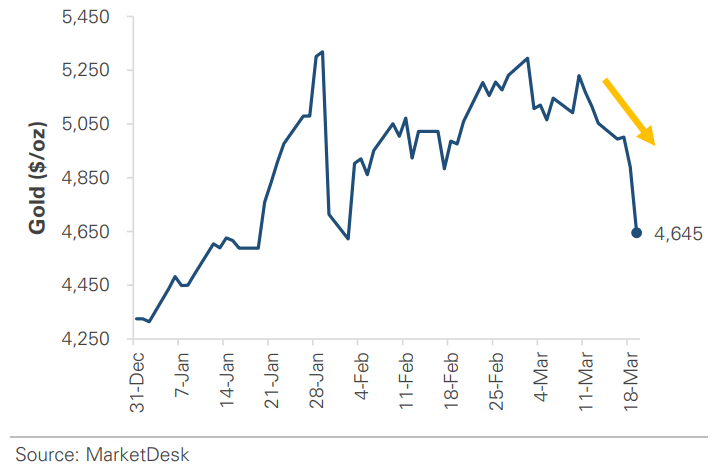
This week mirrored last week: stocks traded higher early, then fell and finished lower in a late-week selloff. The major equities were flat to modestly lower as the Middle East conflict continued, with large caps, small caps, the Nasdaq, and the Dow producing similar returns. Energy was the top-performing sector for a second week, with technology and financial stocks also gaining slightly. Bonds traded higher as the rise in Treasury yields slowed, and longer-maturity bonds outperformed as yields stabilized. Commodities traded lower: oil ended lower but remained stuck near $100 per barrel, gold fell despite market volatility and inflation concerns, and copper dropped nearly -4%. The VIX Index fell below 25 but remains elevated due to unresolved geopolitical tensions.
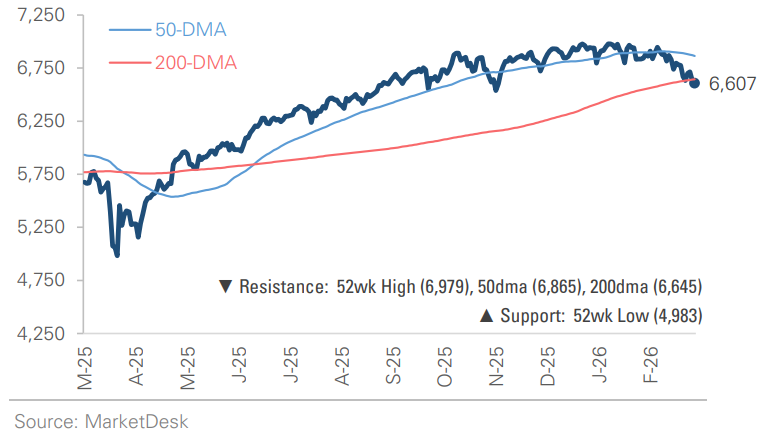
S&P 500 Index (Last 12 Months)
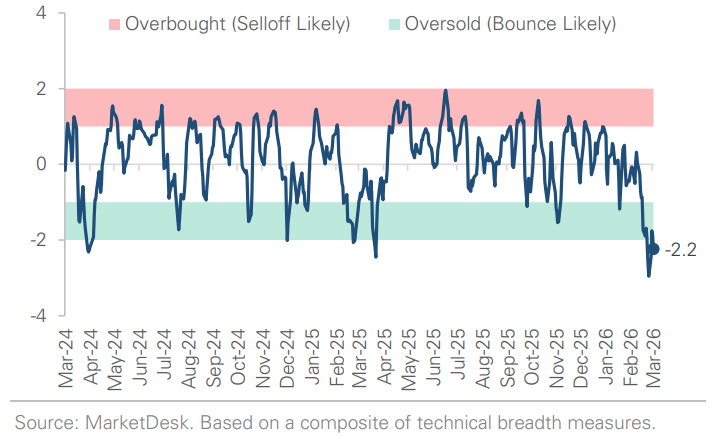
S&P 500 Technical Composite (Last 24 Months)
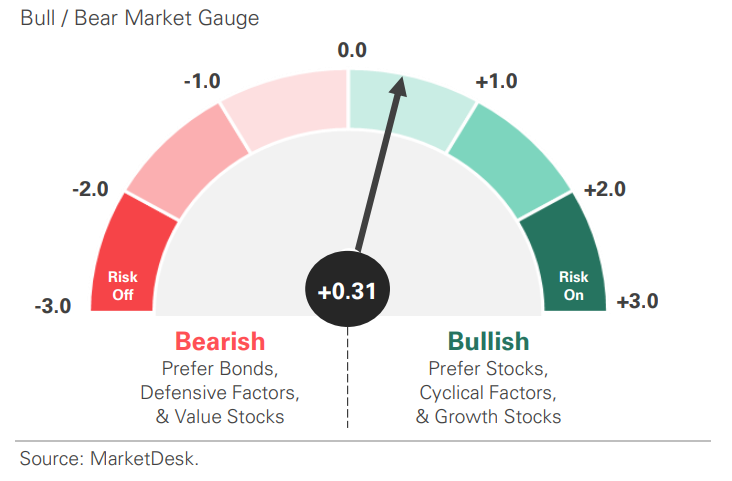
US Risk Demand Market Indicator
The US Risk Demand Indicator (USRDI) is a quantitative tool to measure real-time investor risk appetite. When the indicator is above zero, it signals a risk-on environment favoring cyclical sectors, high beta stocks, high-yield corporate bonds, and hybrid (convertible) bonds. In contrast, a reading below zero signals a risk-off environment favoring defensive sectors, low-volatility stocks, and US Treasury bonds.
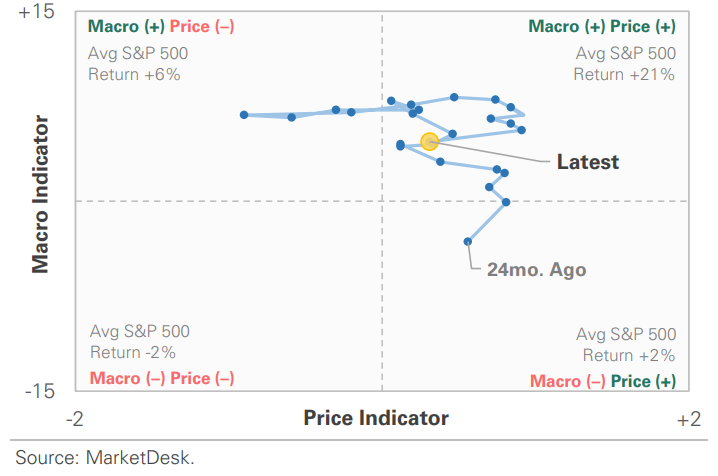
US Market Economic Cycle Indicator
The Market Cycle Indicator tracks two primary investor groups: macro investors and price-based investors. Macro investors rely on fundamental and economic data to guide their decisions, while price-based investors (or technical analysts) focus on price action, momentum, volume, and behavioral trends. The Indicator synthesizes these perspectives to identify the prevailing market regime.
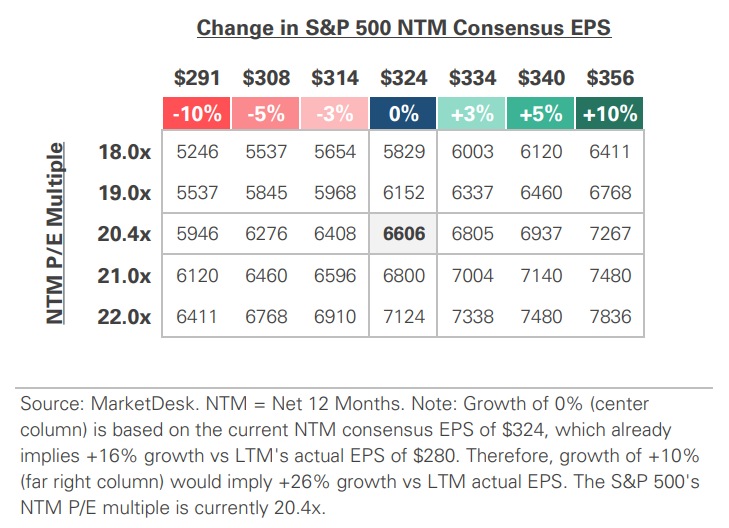
S&P 500 Valuation Matrix
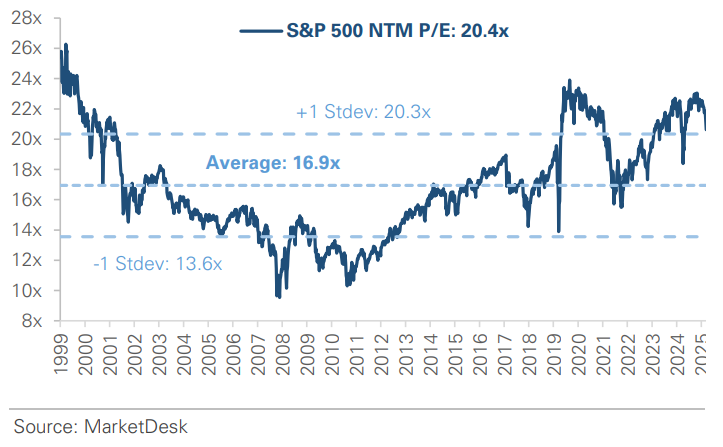
S&P 500 Forward PE Ratio
The S&P 500 forward price-to-earnings (P/E) ratio is a widely followed valuation metric that compares the index's current level to the projected earnings of its constituent companies over the next 12 months. The indicator implies to investors how much they are paying today for each dollar of expected future earnings.
Key Takeaways
#1 - Middle East Conflict Escalates Into Energy Infrastructure
Israel struck Iran’s South Pars gas field, the world’s largest natural gas reserve, and Iran responded by targeting energy infrastructure across the Middle East, disrupting oil and gas production. The conflict has moved beyond shipping-lane disruptions to direct damage to production infrastructure, which can take months or years to repair, not weeks.
Implication: A ceasefire will not necessarily quickly restore the energy supply. Damaged facilities will have to be repaired and rebuilt, which could set a structural floor for energy prices, keeping oil and gas prices higher even if the conflict ends.
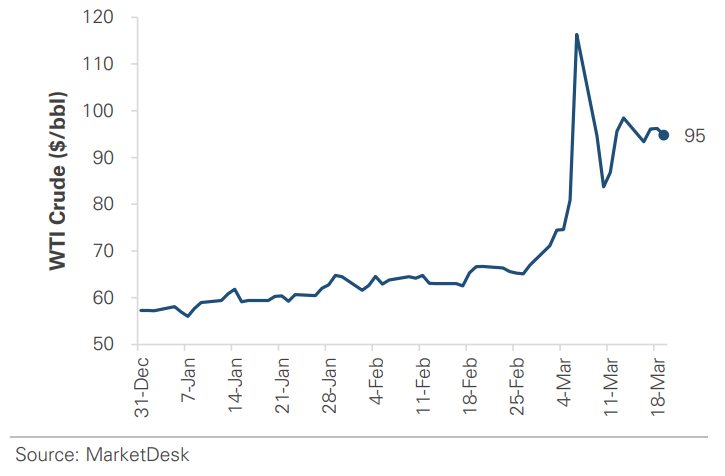
Oil Remains Pinned Near $100 per Barrel
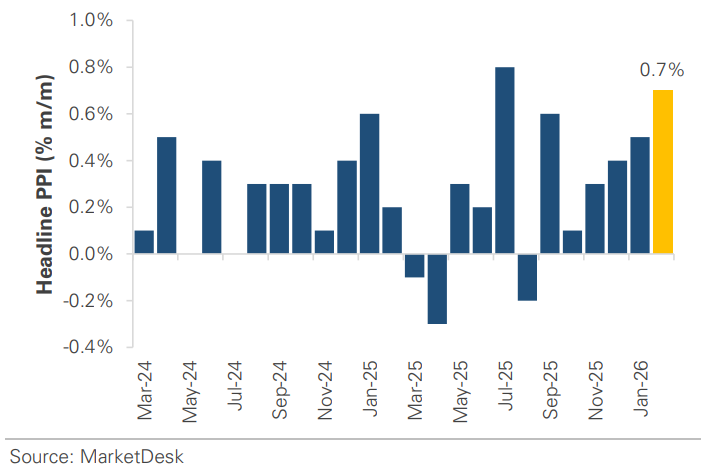
#2 - Producer Prices Rising
The Producer Price Index rose 0.7% m/m in February, the hottest monthly PPI reading since July 2025 and the third consecutive month of acceleration. Headline PPI accelerated to 3.4% y/y from 2.9% in January, and core PPI rose to 3.9% from 3.5%. The data preceded the conflict and sharp rise in oil prices, suggesting inflation pressure was building before the oil spike. The composition also mattered: services drove the increase, pointing to broader pricing pressures than just oil.
Implication: Services-driven inflation is harder to dismiss as transitory and suggests the Fed faces a potential dual battle: goods inflation from energy and services inflation from structural factors.
Producer Prices Accelerate for a Third Straight Month
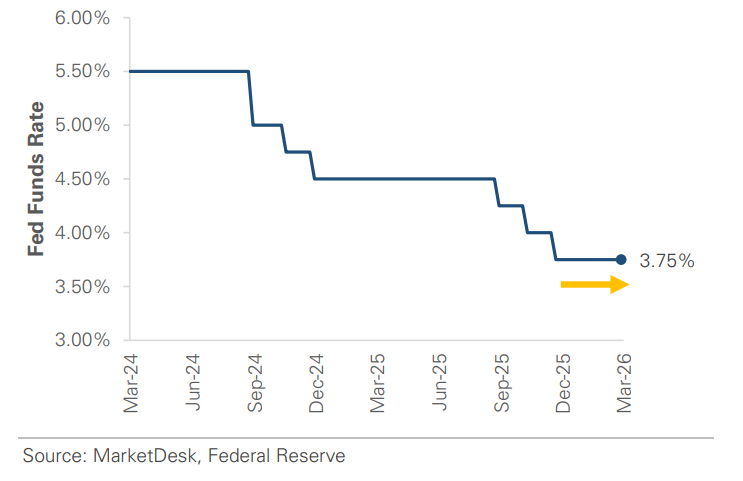
#3 - Fed Holds Rates Steady
The Fed held rates steady at 3.50–3.75% this week and raised its 2026 inflation forecast to 2.7%, up from 2.4% in December. Chair Powell acknowledged that a rate hike was discussed at the meeting, though added that a hike is not the base case. While the Fed still projects one cut this year, futures markets have moved past its forecast. The market expects no rate cuts this year, with the next cut not forecast until July 2027.
Implication: The shift from “when will the Fed cut” to “will the Fed cut at all” is a significant change. Earlier this year, the market expected two rate cuts in 2026, but the narrative is moving toward interest rates remaining higher for longer.
Federal Reserve Holds Interest Rates Steady
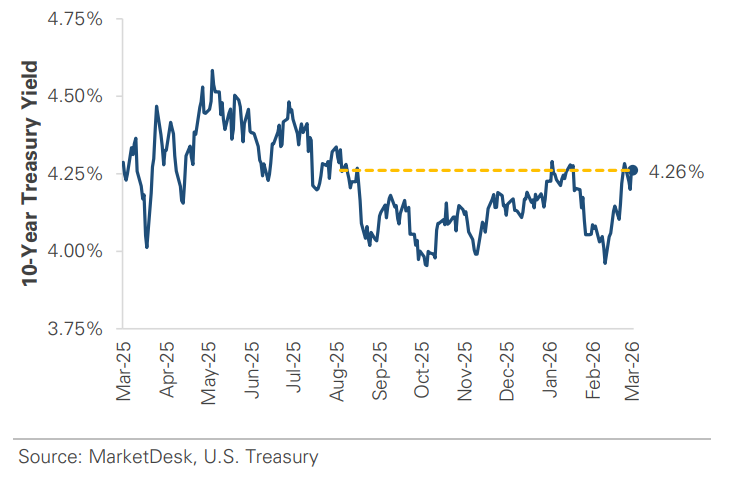
U.S. 10-Year Treasury Yield Remains Elevated
#4 -Stock Market Remains Choppy
The S&P 500 rallied more than 1.0% early in the week before giving it back as tensions escalated, oil prices rose, and rate-cut expectations were delayed. The S&P 500 is now roughly -5% below its all-time high in late-January and down about -3.5% for the year. However, the indicators associated with more serious market stress aren’t yet flashing. The VIX declined during the week and sits near 25, which is elevated but below panic levels. Credit spreads also tightened this week, a countertrend relief rally suggesting the credit market is not pricing imminent stress.
Implication: The pattern of rallying on de-escalation hopes and selling on reality has held for multiple weeks; a durable break in either direction would change the picture, but the current setup remains heightened uncertainty rather than crisis.
Gold Trades Lower Despite Volatility and Inflation Risk
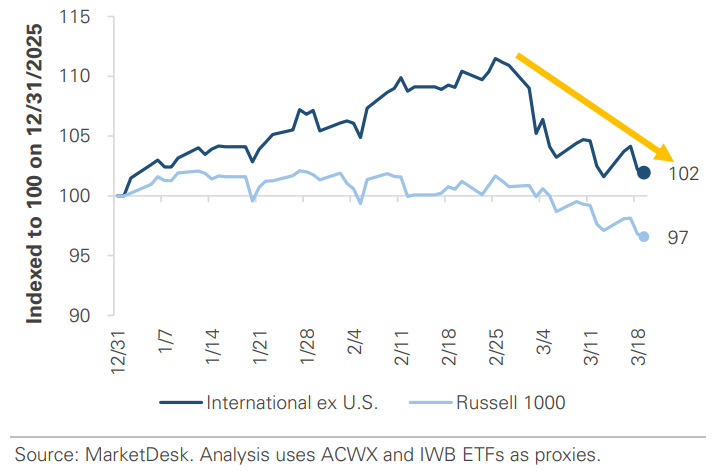
International Stocks Weighed Down by Oil and the US Dollar
#5 - AI Demand Signals Remain Strong
NVIDIA’s developer conference reinforced strong demand for AI, with the company expecting ~$1 trillion in chip orders through 2027, double last October’s figure. Separately, Micron reported quarterly revenue of $23.9 billion, nearly triple last year’s.
Implication: While markets have been volatile, the commentary suggests AI infrastructure spending remains strong. The market will be watching to see whether the conflict affects spending plans, such as tighter financing conditions or smaller budgets due to economic uncertainty.
Important Disclosures
This material is provided for general and educational purposes only and is not investment advice. Your investments should correspond to your financial needs, goals, and risk tolerance. Please consult an investment professional before making any investment or financial decisions or purchasing any financial, securities, or investment-related service or product, including any investment product or service described in these materials.
Our Insights


