Middle East Ceasefire Headlines, Volatile Oil Prices, Stock Market Rotation, and Fed Rate Hikes

Photo Credit: Mariam Soliman, Unsplash
Weekly Market Recap for March 27th
This week, market trading was influenced by ceasefire headlines. The S&P 500 rose early after the administration reported talks with Iran, then reversed to close down nearly -0.5% as Iran denied negotiations and the diplomatic window narrowed. Meanwhile, the market rotation from early 2026 resumed, with small caps, value stocks, and the equal-weight S&P 500 outperforming. Oil dropped nearly -10% on Monday’s ceasefire headline before recovering to close the week down roughly - 5%. Treasury yields ended the week higher despite falling mid-week, credit spreads tightened modestly, and the VIX remained elevated. The week ahead brings the expiration of Trump’s five-day strike pause on Iranian energy infrastructure, along with consumer confidence and ISM Manufacturing PMI, the first major economic data releases that will capture the full impact of the war and the oil shock.
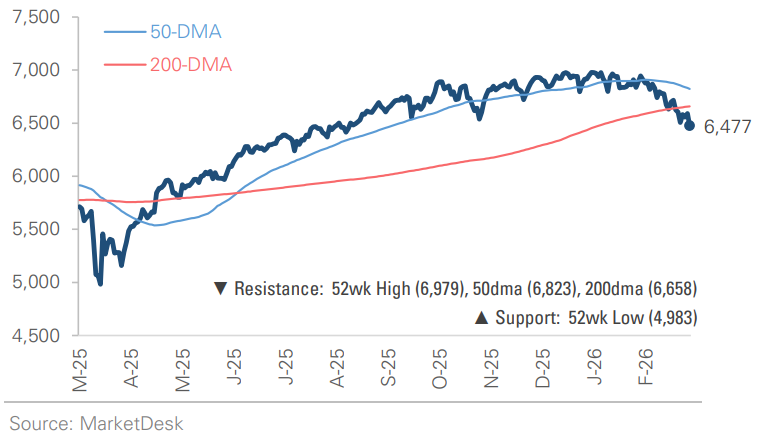
S&P 500 Index (Last 12 Months)
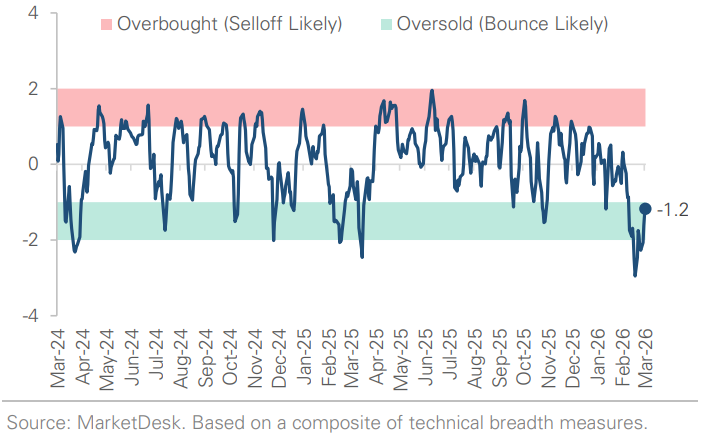
S&P 500 Technical Composite (Last 24 Months)
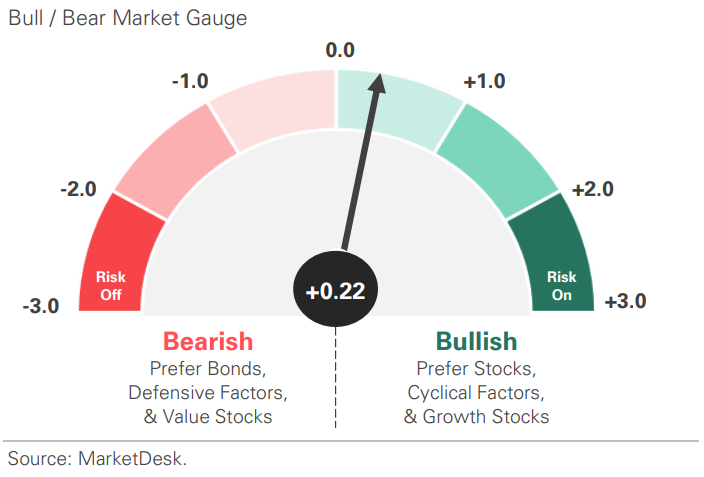
US Risk Demand Market Indicator
The US Risk Demand Indicator (USRDI) is a quantitative tool to measure real-time investor risk appetite. When the indicator is above zero, it signals a risk-on environment favoring cyclical sectors, high beta stocks, high-yield corporate bonds, and hybrid (convertible) bonds. In contrast, a reading below zero signals a risk-off environment favoring defensive sectors, low-volatility stocks, and US Treasury bonds.
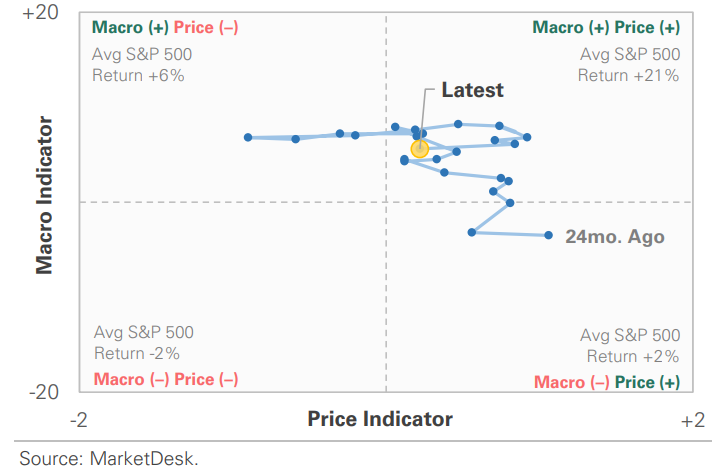
US Market Economic Cycle Indicator
The Market Cycle Indicator tracks two primary investor groups: macro investors and price-based investors. Macro investors rely on fundamental and economic data to guide their decisions, while price-based investors (or technical analysts) focus on price action, momentum, volume, and behavioral trends. The Indicator synthesizes these perspectives to identify the prevailing market regime.
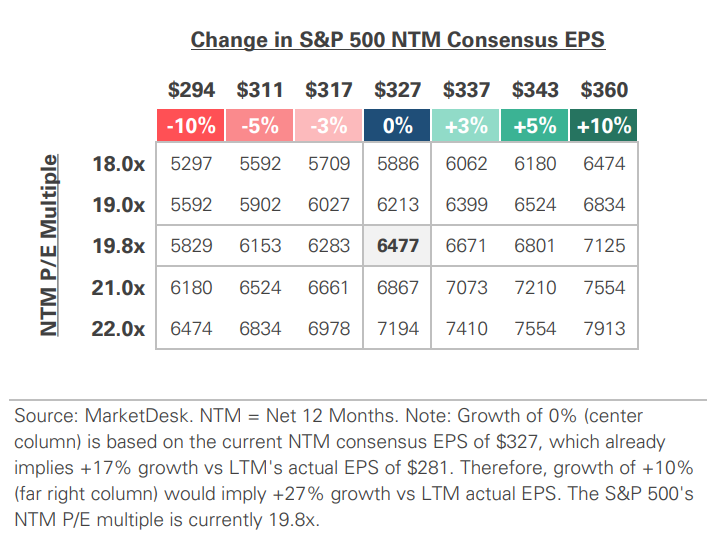
S&P 500 Valuation Matrix
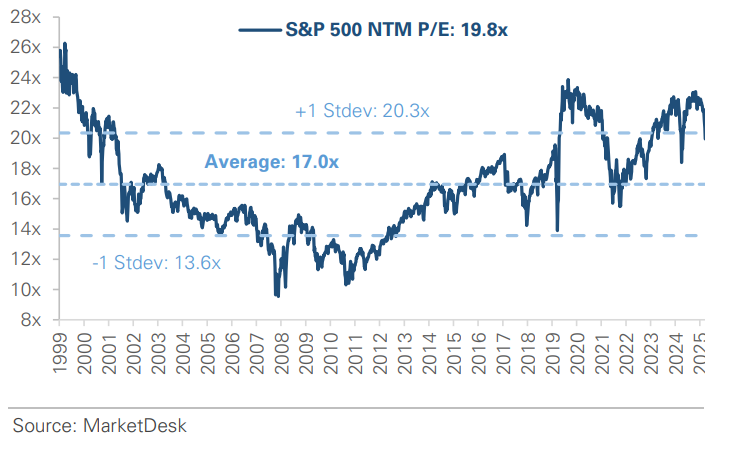
S&P 500 Forward PE Ratio
The S&P 500 forward price-to-earnings (P/E) ratio is a widely followed valuation metric that compares the index's current level to the projected earnings of its constituent companies over the next 12 months. The indicator implies to investors how much they are paying today for each dollar of expected future earnings.
Key Takeaways
#1 - Oil Prices Remain Volatile
Oil markets whipsawed this week as ceasefire headlines between the U.S. and Iran drove sharp swings in both directions. Prices plunged more than -10% early in the week after President Trump described productive discussions and announced a five-day pause in strikes, raising expectations for a diplomatic resolution. Those gains reversed when Iran denied active negotiations and later rejected a formal U.S. ceasefire proposal that included reopening the Strait of Hormuz, which remains closed. Iran’s counteroffer signals that diplomatic channels are open, but no agreement is imminent.
Implication: Oil prices are unlikely to stabilize until there is clarity on whether negotiations can produce a lasting agreement. Each headline-driven swing is a reminder of how much of a geopolitical premium remains embedded in energy markets and the stock market.
#2 - Markets Traded on Ceasefire Headlines
U.S. equities traded higher early in the week, but reversed lower as the week progressed. The S&P 500 rose over +1%, with most of the advance coming on Monday after reports of U.S.–Iran negotiations sparked a broad relief rally. Markets then pulled back the following session as oil rebounded and uncertainty around a deal resurfaced, staged a rebound when news of a formal ceasefire proposal emerged, and ultimately traded lower as tensions escalated again.
Implication: Stocks remain highly sensitive to ceasefire signals, with the direction of oil prices the most reliable real-time indicator of investor confidence in a diplomatic outcome.
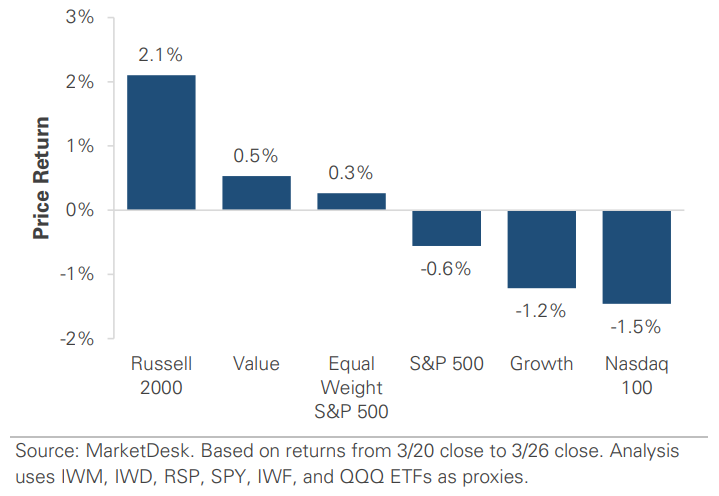
#3 - The Stock Market Rotation Resumes
Market leadership broadened again this week as the rotation away from mega-cap stocks reasserted itself. The Russell 2000 outpaced the S&P 500 during the early-week rally, and the equal-weighted S&P 500 outperformed the cap-weighted index as value stocks pulled ahead of growth. The divergence is consistent with the trend that emerged in early 2026, when investors began moving toward smaller companies, value stocks, and more economically sensitive areas of the market.
Implication: The rotation paused amid market volatility, but it has started to reappear this week. One week does notconfirm a trend, but the broadening is showing up across multiple measures simultaneously, which is more credible than small-cap leadership alone.
The Market Rotation From Early 2026 Resumes
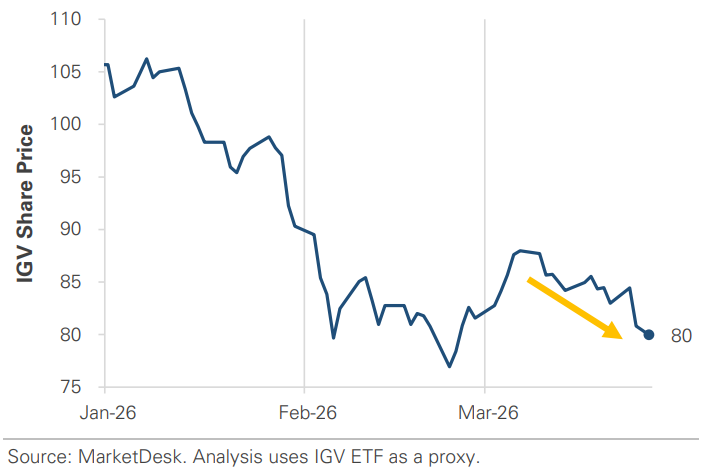
Software Stocks Trade Toward February Lows
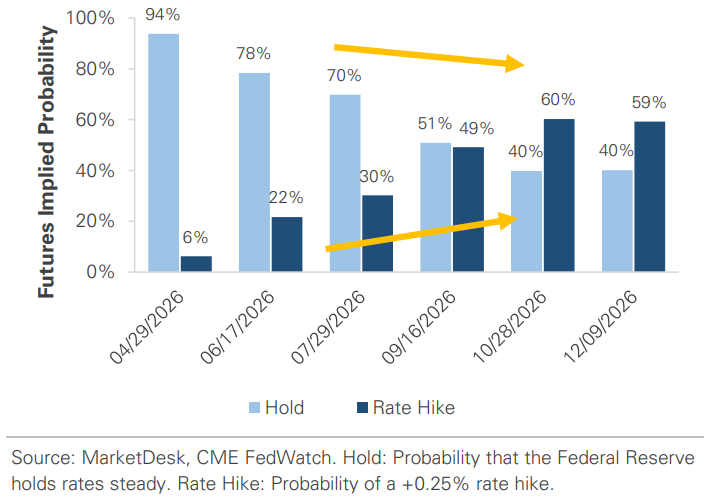
#4 -Rate Hike Probabilities Creep Into Fed Pricing
Interest rate expectations shifted again this week as investors began pricing in the possibility that the Federal Reserve could raise rates later in 2026. Futures markets showed rate-hike probabilities rising above 50% in late 2026, as the market began pricing in a rate hike amid concerns that a sustained rise in oil prices would reignite inflation. At the same time, inflation expectations have slightly reversed lower, suggesting markets still view current inflation pressures as temporary rather than structural.
Implication: The debate has shifted from the timing of cuts to the possibility of a brief hike, and that repricing matters for duration positioning. If oil stabilizes and inflation expectations remain anchored, the probability of a rate hike could fade.
Futures Pricing in the Probability of a 2026 Rate Hike
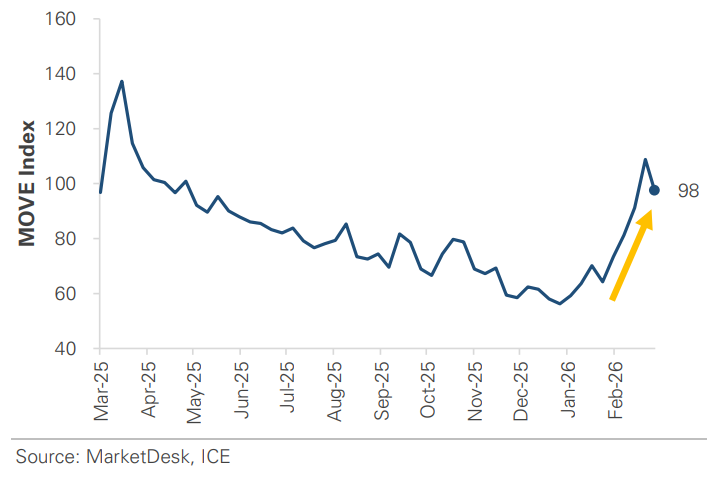
Interest Rate Volatility Rises as Policy Outlook Shifts
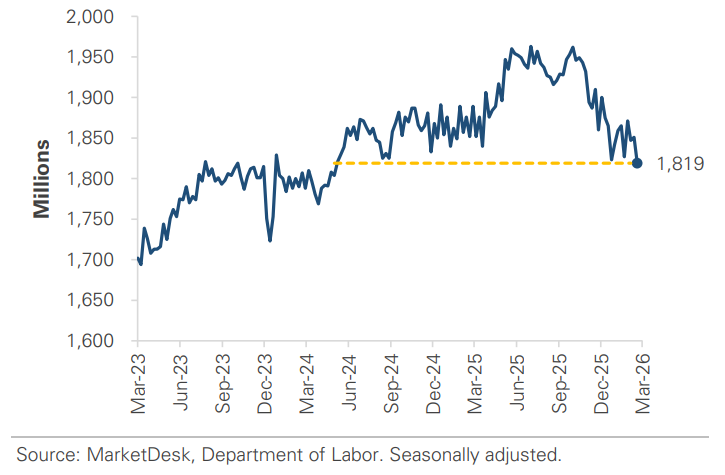
Continuing Jobless Claims Fall to a 2-Year Low
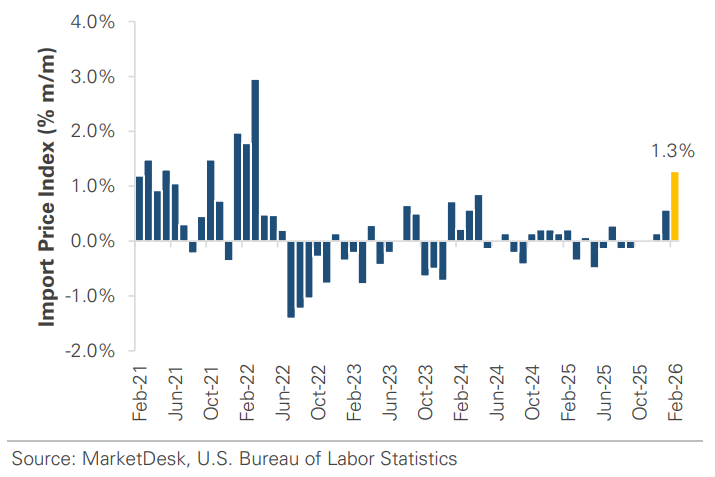
Import Prices Accelerated in February
Important Disclosures
This material is provided for general and educational purposes only and is not investment advice. Your investments should correspond to your financial needs, goals, and risk tolerance. Please consult an investment professional before making any investment or financial decisions or purchasing any financial, securities, or investment-related service or product, including any investment product or service described in these materials.
Our Insights


