Housing Activity, Trade Deals, Q2 Earnings, and Meme Stocks

Photo Credit: Allison Huang, Unsplash
Weekly Market Recap for July 25th
This week, the markets moved higher with the S&P 500 gaining +1% and outperforming the Russell 2000. Defensive sectors, such as Utilities, Health Care, and Real Estate, outperformed, while Technology was flat. Factor returns favored Equal Weight, Value, and Low Volatility, signaling broader participation after Growth and Momentum led in Q2. International equities outperformed US markets, with developed markets outperforming emerging. Treasury yields declined, particularly from the intermediate portion of the yield curve and out, and high yield performed in line with investment grade as credit spreads tightened. FX and commodities were mixed: gold ended flat, oil traded sideways, and the US dollar weakened. The VIX fell to a 2025 low, reflecting investor confidence amid improving breadth, better-than-expected earnings, and progress on trade policy.
S&P 500 Index (Last 12 Months)

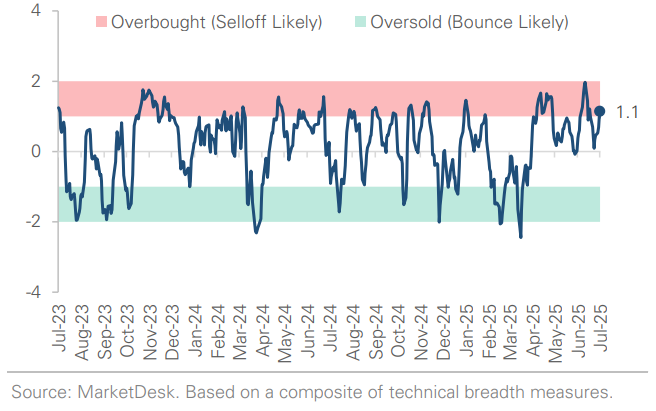
S&P 500 Technical Composite (Last 24 Months)
US Risk Demand Market Indicator
The US Risk Demand Indicator (USRDI) is a quantitative tool to measure real-time investor risk appetite. When the indicator is above zero, it signals a risk-on environment favoring cyclical sectors, high beta stocks, high-yield corporate bonds, and hybrid (convertible) bonds. In contrast, a reading below zero signals a risk-off environment favoring defensive sectors, low-volatility stocks, and US Treasury bonds.

US Market Economic Cycle Indicator
The Market Cycle Indicator tracks two primary investor groups: macro investors and price-based investors. Macro investors rely on fundamental and economic data to guide their decisions, while price-based investors (or technical analysts) focus on price action, momentum, volume, and behavioral trends. The Indicator synthesizes these perspectives to identify the prevailing market regime.

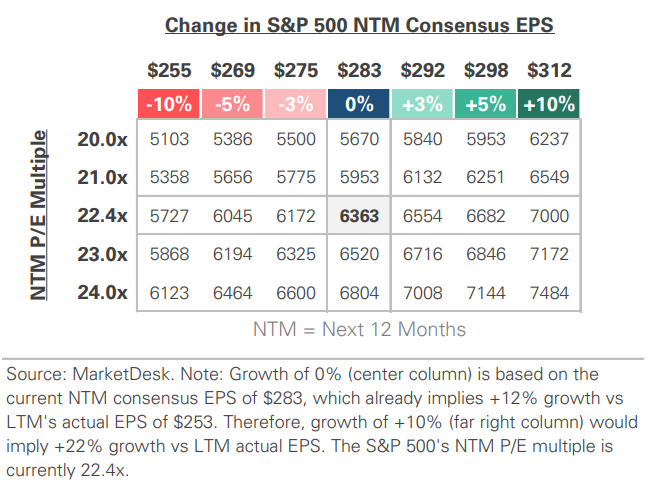
S&P 500 Valuation Matrix
Key Takeaways
#1 - Housing Activity Remains Sluggish
Building permits were flat compared to May (+0.2% m/m) but fell -4.4% year-over-year. Single-family permits fell -3.7% m/m, signaling weak construction activity ahead. Housing starts rose +4.6% m/m, primarily driven by the volatile multifamily category (+30.6% m/m), while single-family fell -4.6% m/m. Existing-home sales dropped -2.7% to a 9-month low as 30-year mortgage rates hovered near 6.8%. Housing inventory continues to climb, but prices hit a record high in June as rate-locked homeowners remain unwilling to sell.
Implication: Residential construction likely subtracted from GDP in Q2, and high mortgage rates and soft single-family activity point to continued weakness.
Housing Activity Remains Sluggish

Single-Family Construction Activity Remains Weak

#2 - Trade Policy Progress
Japan struck a deal with the U.S., agreeing to a flat 15% tariff on autos and most exports while committing up to $550 billion in U.S. supply chain investments. The agreement helped Tokyo avoid a steeper 30% “liberation-day” tariff and marked a breakthrough in the Trump administration’s trade policy. Attention now shifts to the EU, where talks are underway to secure an agreement before the 8/1 deadline.
Implication: The Japan deal removed a tail risk and sparked a relief rally, but the real test comes with the EU. An agreement could establish 15% as the global norm, but a breakdown could reignite tariff anxiety.
#3 - S&P 500 Corporate Earnings Off to Strong Start
With about 30% of S&P 500 companies reporting Q2 results, earnings are off to a stronger-than-expected start. Over 80% have beat estimates, lifting blended EPS growth to 6–7% from 4.8% at June’s end. Financials are delivering the biggest surprises, with banks reporting strong trading and deal activity. Alphabet’s results and capex outlook reinforce the AI investment theme, while tariff impacts are prompting negative guidance revisions at companies such as General Motors and Mattel.
Implication: The bar was low heading into earnings season, and companies are clearing it. However, 6-7% EPS growth would still be the slowest since late 2023.
More S&P 500 Companies Beating EPS Estimates

#4 - MEME Stocks
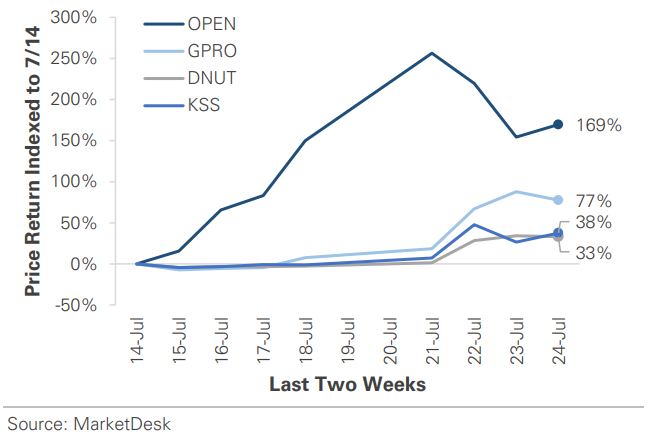
Meme stock fever returned this week as retail traders targeted heavily shorted names, including Opendoor, Kohl’s, Krispy Kreme, and GoPro. The stocks registered 25% to 100% intraday gains, fueled by high short interest, thin floats, and viral social media buzz.
Implication: The resurgence of meme-stock trading signals a revival in retail risk appetite similar to 2021. With the S&P 500 and Nasdaq trading at record highs and trade tensions easing, risk appetite has spilled into “lottery-ticket” corners of the market.
MEME Stock Returns
S&P 500 and NASDAQ Continue To Set Record Highs

#5 - Next Week’s Calendar
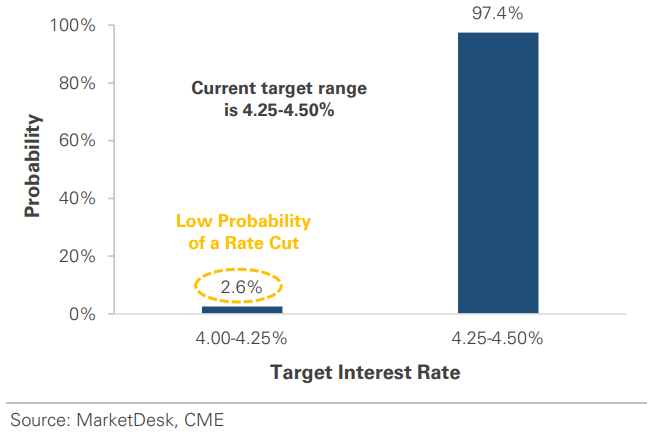
The main event is the Fed’s 7/30 meeting, where the central bank must balance inflation risk against signs of slowing economic growth. A wave of toptier data surrounds the Fed meeting, with Q2 GDP, the Employment Cost Index, and PCE inflation offering fresh insight into economic growth, wages, and price pressures. The week ends with July payrolls and ISM manufacturing, while tech earnings from Microsoft, Meta, Apple, and Amazon will be analyzed for clues about AI capex.
Implication: Next week touches on all the macro themes the market cares about: economic growth, inflation, labor market momentum, and AI earnings. The results could either support the current market narrative (resilient economy, AI growth, and sticky inflation) or challenge it, potentially triggering a market repricing.
Fed Expected To Hold Rates Steady Next Week
Important Disclosures
This material is provided for general and educational purposes only and is not investment advice. Your investments should correspond to your financial needs, goals, and risk tolerance. Please consult an investment professional before making any investment or financial decisions or purchasing any financial, securities, or investment-related service or product, including any investment product or service described in these materials.
Our Insights