Inflation Data Takes Center Stage

Photo Credit: Getty Images, Unsplash
Weekly Market Recap for August 15th
This week, markets rallied on renewed risk-on sentiment. The S&P 500 reached a new record, but small caps led after a cool CPI print raised expectations for a September rate cut. High Beta stocks extended their outperformance, while Low Volatility and Momentum factors lagged. Cyclical sectors outperformed, led by Communication Services, Financials, and Health Care, while defensives such as Utilities, Real Estate, and Consumer Staples trailed. International stocks also traded higher, with developed markets performing in line with the S&P 500 and emerging markets underperforming. Treasury yields rose across the yield curve, weighing on long-duration Treasury bonds. Corporate credit spreads edged lower, and high yield slightly outperformed investment grade. Oil and the US dollar changed little, while gold was traded lower.
S&P 500 Index (Last 12 Months)

S&P 500 Technical Composite (Last 24 Months)
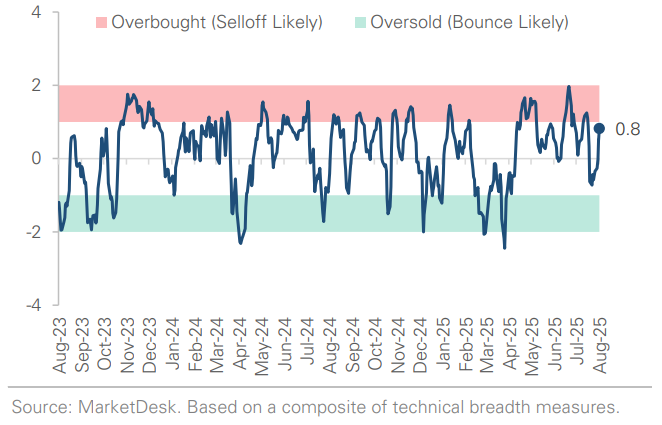
US Risk Demand Market Indicator
The US Risk Demand Indicator (USRDI) is a quantitative tool to measure real-time investor risk appetite. When the indicator is above zero, it signals a risk-on environment favoring cyclical sectors, high beta stocks, high-yield corporate bonds, and hybrid (convertible) bonds. In contrast, a reading below zero signals a risk-off environment favoring defensive sectors, low-volatility stocks, and US Treasury bonds.

US Market Economic Cycle Indicator
The Market Cycle Indicator tracks two primary investor groups: macro investors and price-based investors. Macro investors rely on fundamental and economic data to guide their decisions, while price-based investors (or technical analysts) focus on price action, momentum, volume, and behavioral trends. The Indicator synthesizes these perspectives to identify the prevailing market regime.

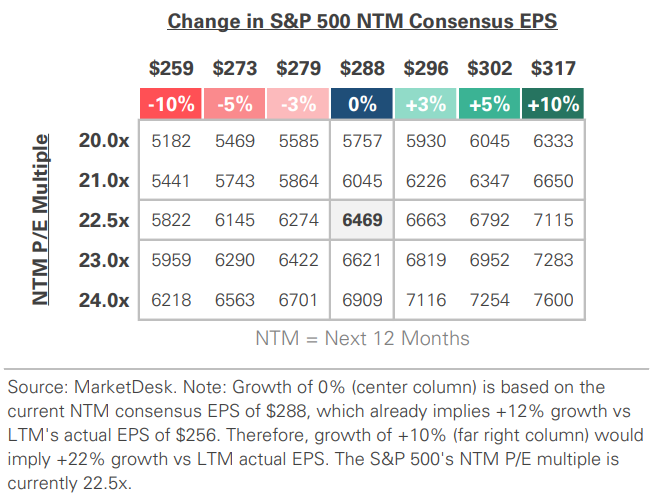
S&P 500 Valuation Matrix
Key Takeaways
#1 - Inflation Cools
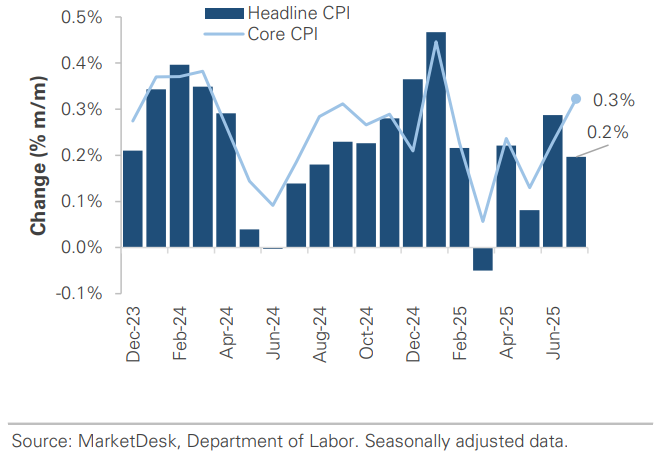
Headline Consumer Price Index (CPI) rose +0.2% in July, down from +0.3% last month, but the year-over-year rate held steady at +2.7%. Falling energy prices and flat food prices helped cool the headline number, but core inflation remained sticky. Core CPI rose +0.3%, the fastest pace since January, and up from +0.2% in June. The pickup was driven by a +0.4% rise in core services, an increase from last month’s +0.3%. Core goods rose +0.2%, in line with the prior month, with tariff-affected categories such as household furnishings and apparel showing modest gains after sharp increases last month.
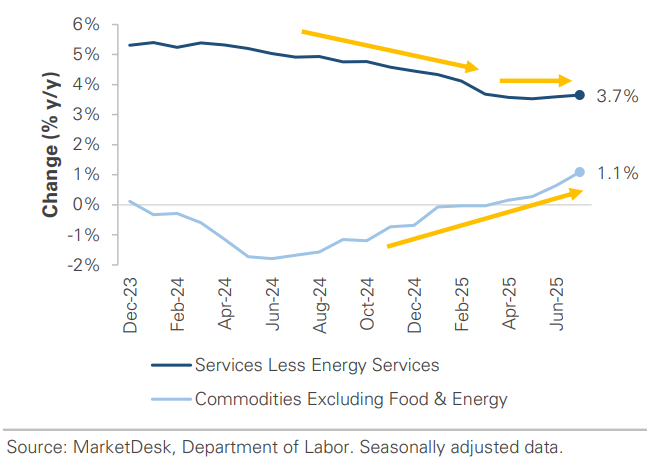
Implication: Disinflation progress has slowed in recent months. Services inflation remains sticky, and while goods inflation is below target, it is been trending higher since late 2024. The combination could make it difficult to get back to the Fed’s 2% target.
Headline CPI Falls While Core CPI Rises
Services Disinflation Stalls While Goods Trend Higher
#2 - US Producer Price Index Rising
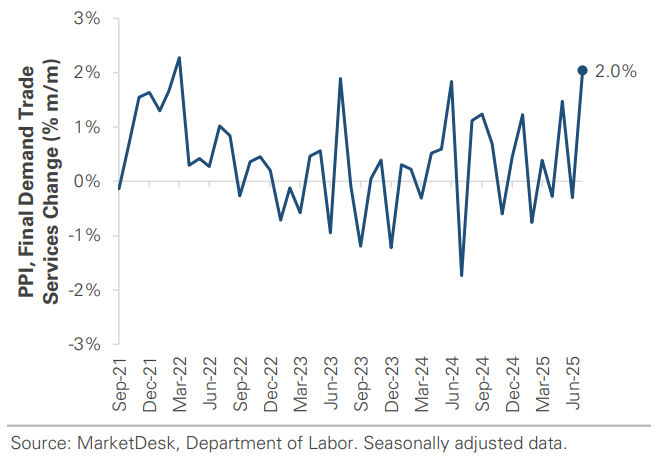
Later in the week, data showed that the US Producer Price Index (PPI) surged +0.9% in July (+3.3% y/y), the biggest monthly gain in three years and well above expectations. Services, particularly trade margins (+2.0%), led the increase, with contributions from machinery and equipment wholesaling, financial services, lodging, and freight. Core PPI, which excludes food, energy, and trade services, rose +0.6%, the fastest pace since March 2022. Inflation pressures also intensified as prices rose for processed intermediate goods, unprocessed goods, and intermediate services.
Implication: Rising producer prices indicate inflation pressures are building upstream. If those pressures persist, CPI could accelerate in Q4.
Producer Prices Rise at the Fastest Pace in 3 Years

#3 - Tariff Passthrough
The hotter-than-expected PPI report and in-line CPI report offer clues about tariff passthrough. The trade services index in PPI, which measures wholesaling margins, accounted for most of the hot services PPI print. Wider trade margins signal rising cost pressures upstream and indicate distributors are raising prices to protect profit margins. The in-line CPI report, with a steady core goods reading, means companies are not fully passing through tariffs at this point, instead relying on promotions and non-tariffed inventories to remain competitive.
Implication: July data indicate tariffs are being passed through, but selectively and with lags. If CPI continues to run cooler than PPI in the coming months, it will suggest that companies absorb tariffs, which could weigh on profit margins and stock prices.
Distributors Appear to be Passing Through Tariffs
#4 - Potential September Fed Rate Cut
The July CPI report raises the probability of a September rate cut, particularly after the weak jobs report. In late July, the market expected only one cut this year. It expects one in September, a second in October or December, and a third in January.
Implication: Unless domestic demand strengthens, the economy appears set to downshift in 2H 2025.
Small Cap Stocks Rally on Rate Cut Expectations

#5 - US - China Tariff Trade Truce
The US and China extended their tariff truce by 90 days, pushing the deadline to November 10th and preventing levies from reverting back to extreme levels. The extension reduces near-term inflation and supply-chain risk as retailers finish holiday stocking, and it keeps the door open to further talks and a possible Trump–Xi meeting later this year.
Implication: It is another pause rather than a resolution. The market gets immediate relief from the risk of higher goods prices and the risk to corporate profit margins and economic growth. Still, headline risk will return as the new November deadline approaches.
Important Disclosures
This material is provided for general and educational purposes only and is not investment advice. Your investments should correspond to your financial needs, goals, and risk tolerance. Please consult an investment professional before making any investment or financial decisions or purchasing any financial, securities, or investment-related service or product, including any investment product or service described in these materials.
Our Insights


