Consumer Spending, Manufacturing, Housing, and Corporate Bond Credit Spreads

Photo Credit: Shadi Kimchi, Unsplash
Weekly Market Recap for August 22nd
This week, risk-off sentiment dominated, with equities broadly lower. The S&P 500 declined, led by weakness in mega-cap stocks and the Nasdaq. Small caps traded lower but performed in line with the S&P 500, while Low Volatility and the Equal Weight S&P 500 outperformed, indicating the average stock fell less than the index. Defensive sectors outperformed, including Health Care, Real Estate, and Consumer Staples, while Technology and Consumer Discretionary underperformed. International equities outperformed, with developed leading emerging. Bonds traded lower as Treasury yields drifted higher, and high-yield outperformed investment grade. Commodities were steady, with oil and gold changing little, while the U.S. dollar strengthened modestly. Volatility increased across asset classes, with the VIX and MOVE indices rising.
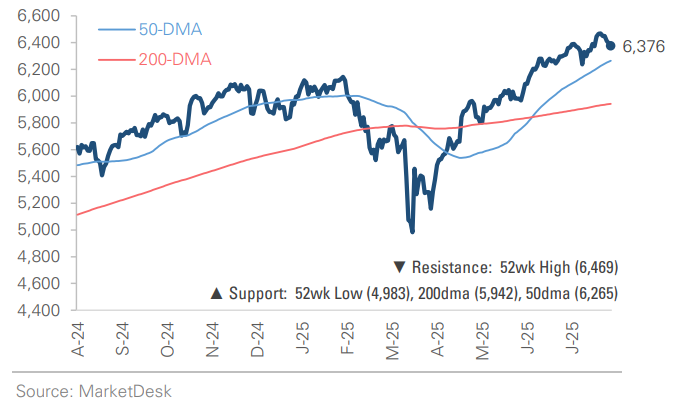
S&P 500 Index (Last 12 Months)
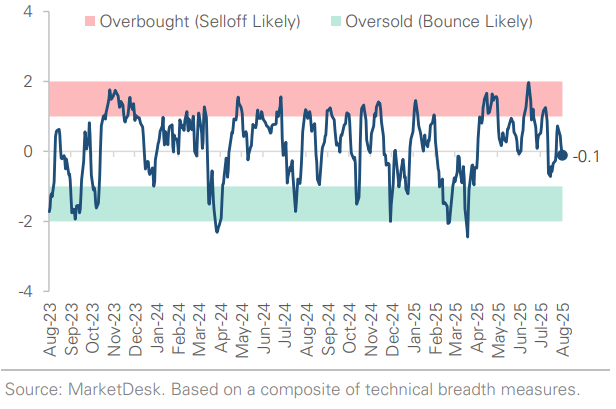
S&P 500 Technical Composite (Last 24 Months)
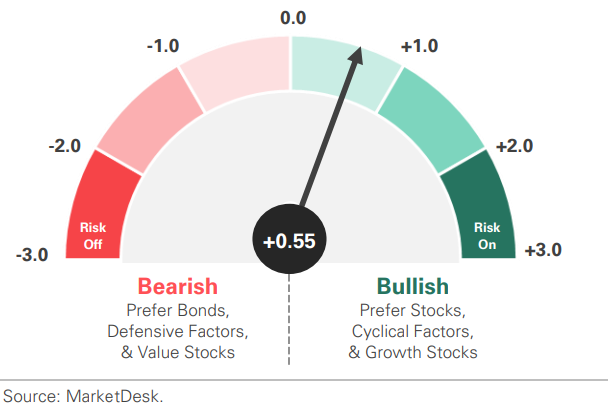
US Risk Demand Market Indicator
The US Risk Demand Indicator (USRDI) is a quantitative tool to measure real-time investor risk appetite. When the indicator is above zero, it signals a risk-on environment favoring cyclical sectors, high beta stocks, high-yield corporate bonds, and hybrid (convertible) bonds. In contrast, a reading below zero signals a risk-off environment favoring defensive sectors, low-volatility stocks, and US Treasury bonds.
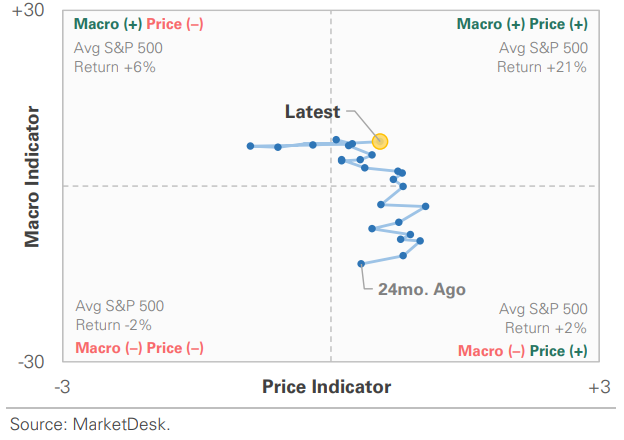
US Market Economic Cycle Indicator
The Market Cycle Indicator tracks two primary investor groups: macro investors and price-based investors. Macro investors rely on fundamental and economic data to guide their decisions, while price-based investors (or technical analysts) focus on price action, momentum, volume, and behavioral trends. The Indicator synthesizes these perspectives to identify the prevailing market regime.
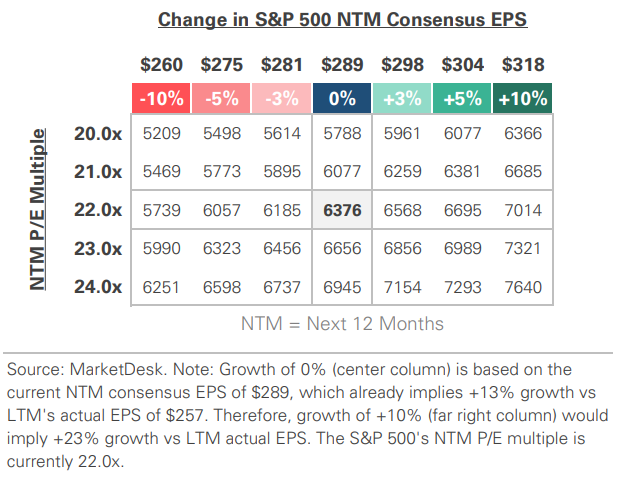
S&P 500 Valuation Matrix
Key Takeaways
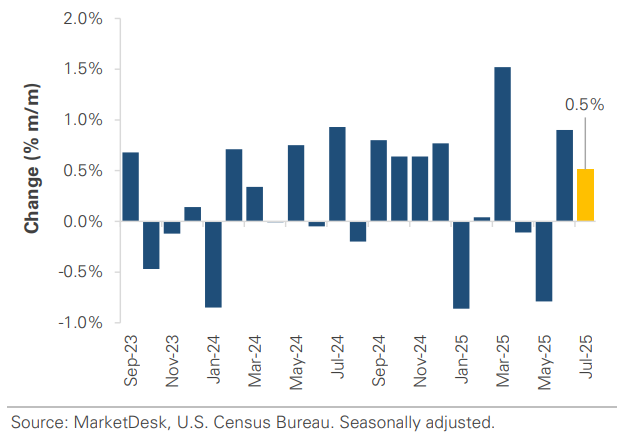
#1 - US Retail Sales Rise
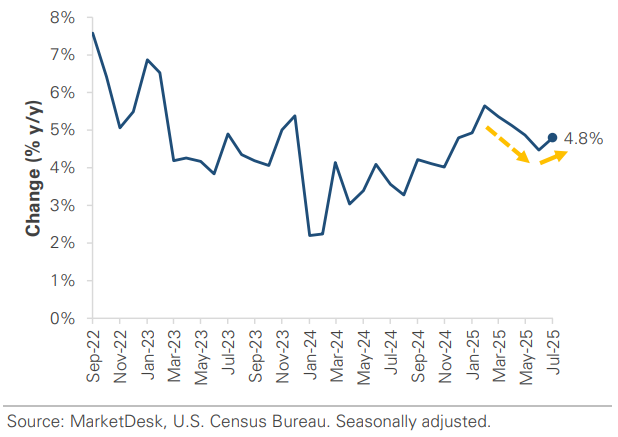
US retail sales rose +0.5% in July, with broad-based gains and an upward revision to June. Auto sales led the gains, likely boosted by consumers accelerating electric vehicle purchases ahead of the September 30th tax credit phase-out. Online shopping also saw strong gains, lifted by promotions such as Prime Day and Walmart Deals, and spending on clothing, furniture, and sporting goods was strong. The core retail “control group,” which excludes volatile categories and feeds directly into GDP, rose +0.5% month-over-month and nearly +5% year-over-year, signaling strong underlying demand. Despite the broad strength, there were areas of weakness, including building materials, restaurants, and electronics.
Implication: July retail sales show a solid start to Q3, with autos and online shopping driving growth. If momentum holds, the case for rate cuts weakens; however, any cracks in spending could bring them back into focus.
Retail Sales Post Second Conservative Month of Growth
Control Group Stabilizes After 1H25 Slowdown
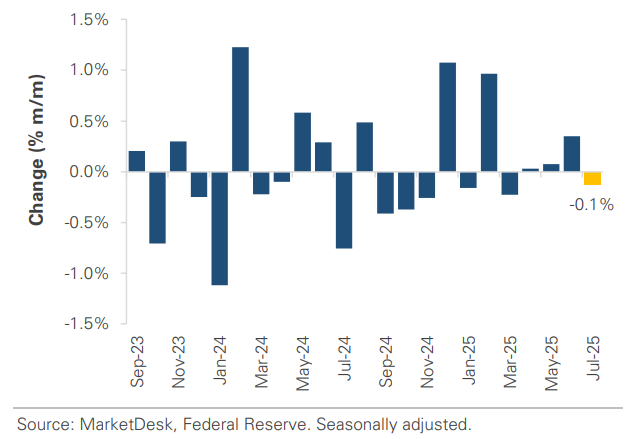
#2 - US Industrial Production Flat
Industrial production fell by –0.1% in July after a +0.4% rise in June. Manufacturing was flat, while mining (–0.4%) and utility output (–0.2%) declined. Beneath the surface, durable goods production rose +0.3%, led by aerospace, electrical equipment, and autos. High-tech industries continued to shine with a +1.4% monthly increase, suggesting the AI capex cycle remains a powerful tailwind.
Implication: July’s report indicates industrial activity stabilizes as producers navigate tariffs, trade negotiations, and an uncertain outlook.
Industrial Production Contracts in July
#3 - US Housing Starts
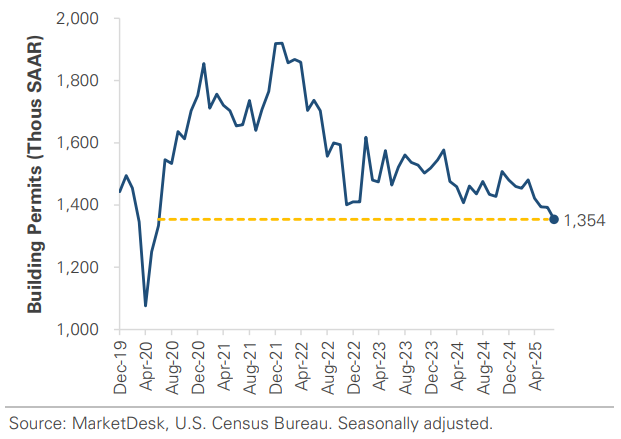
US housing starts rose by over +5% for a second consecutive month in July. The strength came from multifamily starts, which jumped +11.6% to the highest level since May 2023, while single-family rose +2.8%. In contrast, building permits fell -2.8%, hitting a five-year low and signaling softness in the coming months. The data shows housing is caught between short-term rental-driven growth and structural headwinds, including high rates, rising costs, and weak builder confidence.
Implication: July’s housing data offers mixed signals: activity has improved from recent lows, but permits remain soft. The combination suggests housing could remain a headwind in 2H 2025
Multifamily Drives Housing Starts Rebound

Building Permits Fall to 5-Year Low
#4 - Economic Slowdown
Economic activity cooled in Q2 due to tariffs and policy uncertainty, and our US Business Cycle Indicator slipped into contraction. However, the economy reaccelerated as the quarter progressed, and the momentum has carried over into early Q3. The backdrop looks similar to earlier this year: steady consumer spending, sluggish manufacturing, and weakness in housing.
Implication: On balance, the data points to an economic slowdown rather than a recession.
#5 - US Investment Grade Credit Spreads Tighten
Investment-grade credit spreads are the tightest since 1998. Several forces are driving spreads tighter: falling rate volatility, strong demand for quality yield, Fed rate cut expectations, and solid corporate fundamentals. Despite being tight, the index’s effective yield is near ~5%, so the “all-in” IG yields remain attractive even as the credit risk premium is thin.
Implication: At ~0.75%, IG spreads are rich versus history and offer limited compensation for downgrade/default, liquidity, and macro risk. This tightness aligns with a soft-landing narrative but leaves little room for error if economic growth weakens or inflation reaccelerates.
Important Disclosures
This material is provided for general and educational purposes only and is not investment advice. Your investments should correspond to your financial needs, goals, and risk tolerance. Please consult an investment professional before making any investment or financial decisions or purchasing any financial, securities, or investment-related service or product, including any investment product or service described in these materials.
Our Insights


