Delayed Inflation Data, Fed Rate Cut, AI Earnings, and US-China Trade Meeting

Photo Credit: Getty Images, Unsplash
Weekly Market Recap for October 31st
This week, markets were mixed as early strength gave way to caution following Fed commentary and tech earnings. Stocks initially rallied after last week’s better-than-expected inflation report, sending the S&P 500, Nasdaq, and Dow Jones to new highs. However, the strength faded after the Fed cut, with Chair Powell questioning a December cut. Mega-cap tech earnings also weighed on sentiment, as companies reported strong growth and forecasts for rising capital expenditures. Market breadth weakened, and small-cap stocks underperformed. Treasury yields rose after the Fed meeting, as the market priced in a lower probability of a December rate cut. Bonds traded lower, with longer-maturity bonds underperforming. Commodities were mixed: oil gave back recent gains, while gold stabilized after last week’s sell-off.
S&P 500 Index (Last 12 Months)

S&P 500 Technical Composite (Last 24 Months)
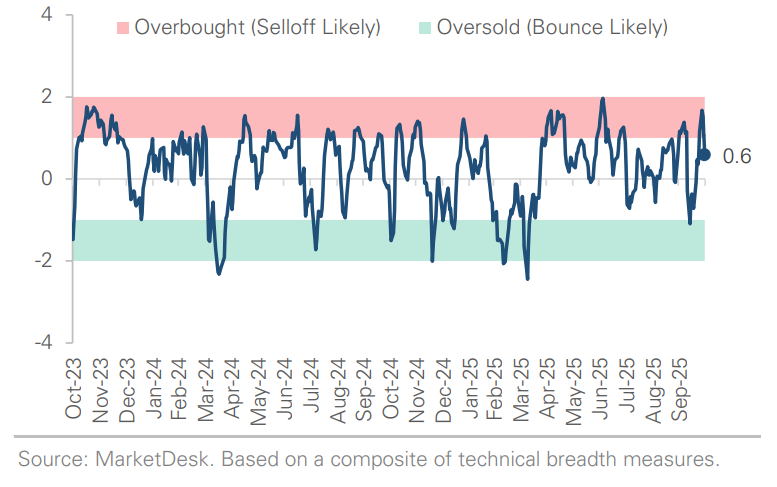
US Risk Demand Market Indicator
The US Risk Demand Indicator (USRDI) is a quantitative tool to measure real-time investor risk appetite. When the indicator is above zero, it signals a risk-on environment favoring cyclical sectors, high beta stocks, high-yield corporate bonds, and hybrid (convertible) bonds. In contrast, a reading below zero signals a risk-off environment favoring defensive sectors, low-volatility stocks, and US Treasury bonds.

US Market Economic Cycle Indicator
The Market Cycle Indicator tracks two primary investor groups: macro investors and price-based investors. Macro investors rely on fundamental and economic data to guide their decisions, while price-based investors (or technical analysts) focus on price action, momentum, volume, and behavioral trends. The Indicator synthesizes these perspectives to identify the prevailing market regime.

S&P 500 Valuation Matrix

S&P 500 Forward PE Ratio
The S&P 500 forward price-to-earnings (P/E) ratio is a widely followed valuation metric that compares the index's current level to the projected earnings of its constituent companies over the next 12 months. The indicator implies to investors how much they are paying today for each dollar of expected future earnings.

Key Takeaways
#1 - Government Shutdown Continues
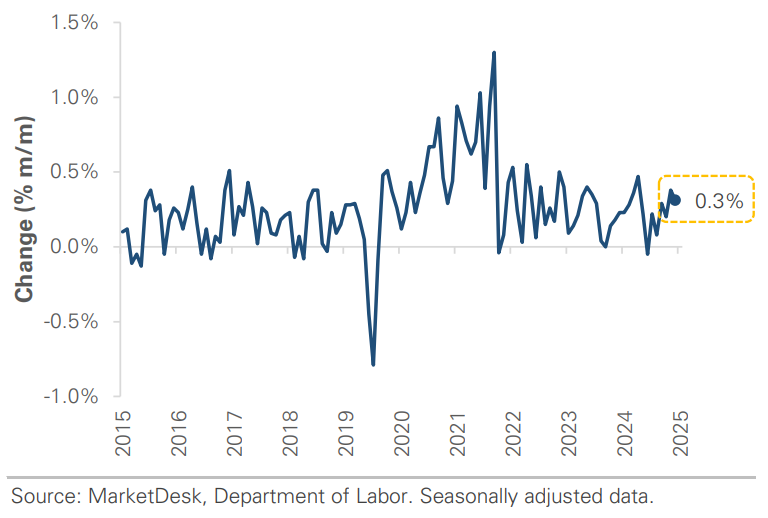
The government shutdown continues, but markets received their first major economic data in nearly a month. A delayed CPI report showed a modest easing in inflation for September, reinforcing expectations for an October rate cut, which the Federal Reserve delivered this week. The central bank cut interest rates by -0.25% for a second straight meeting as it pivots from fighting inflation to supporting a softening labor market.
Implication: While inflation remains above the 2% target, the report signals inflation pressure is easing. Cooling shelter and goods inflation point to further easing into year-end, giving the Fed breathing room.
Inflation Remains Above Target, But Below Expectations
Fed Cuts Interest Rates by -0.25%

#2 - Fed Meeting Reveals Internal Divisions
This week's Fed meeting revealed internal divisions, with one member favoring a -0.50% cut and another favoring no cut. In his press conference, Fed Chair Powell emphasized that another cut in December is "not a foregone conclusion". The internal division and Powell's hawkish statement tempered market enthusiasm, with the odds of a December cut falling from over 90% to 70%.
Implication: Powell's cautious tone contradicted market pricing and expectations for another rate cut this year. Stocks traded lower and Treasury yields rose as investors priced in the potential for no rate cut in December.
Probability of December Rate Cut Declines

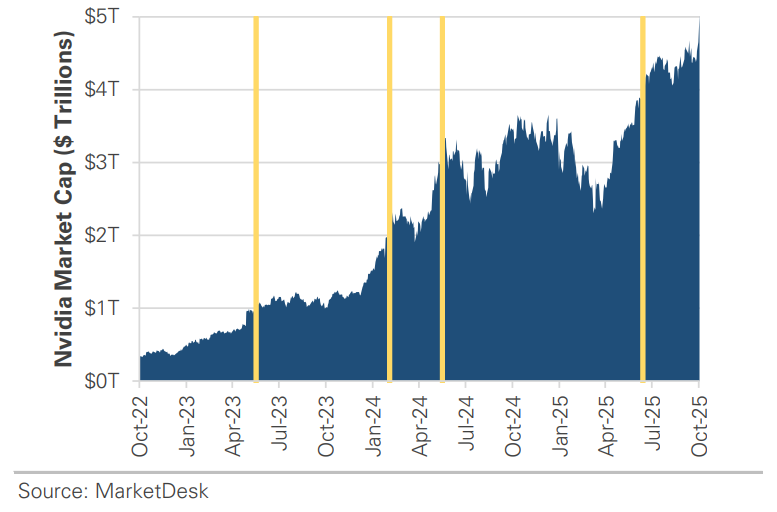
#3 - Nvidia Reaches a $5 Trillion Market Cap
Nvidia has become the first company to reach a $5 trillion market cap, just three months after crossing the $4 trillion mark. Nvidia has surged +50% this year, driven by demand for its AI chips. Nvidia's market cap now exceeds the GDP of several large countries and surpasses the combined values of Tesla, Meta, and Netflix, underscoring its dominant position in the AI chip market and broader tech industry.
Implication: This milestone reflects the market's continued confidence in Nvidia as the central player powering the AI boom.
Nvidia’s Market Cap Surpasses $5 Trillion
#4 - Mega- Cap Tech Company Earnings
Earnings from several mega-cap tech companies this week explain Nvidia's rise. Microsoft, Meta, and Google all reported sharp increases in capital expenditures, as they compete to secure computer chips, build data centers, and establish dominant positions in cloud AI infrastructure. All three companies reported strong AI product adoption metrics, but early monetization results have been limited relative to the scale of investment.
Implication: Leading AI companies are racing to build infrastructure faster than they can monetize it, betting that AI will eventually justify today's investment. The market is rewarding the companies' AI growth potential for now, despite some skepticism around the return on investment.
AI Hyperscaler Capex Continues to Grow

AI Rally Raises Concerns About Market Breadth
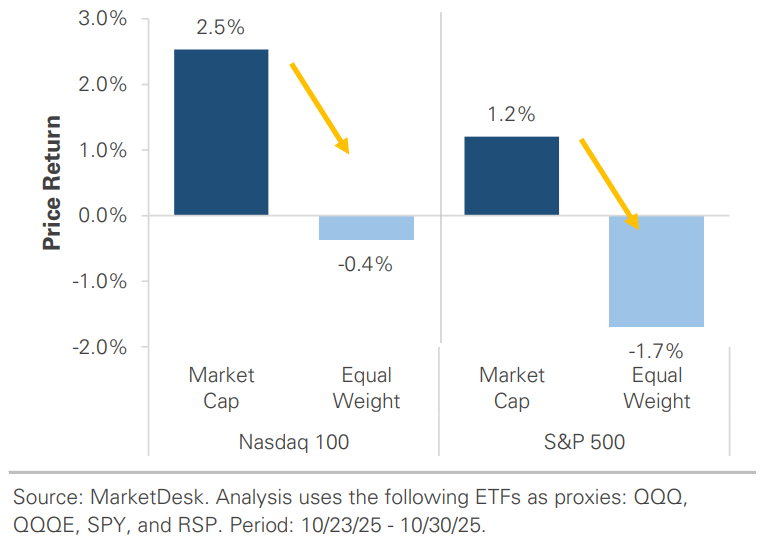
#5 - Market Record Highs
The S&P 500 and Nasdaq set multiple record highs this week, but the equal-weight versions of both indices declined. The divergence indicates the average stock underperformed the index.
Implication: The rally in mega-cap tech and AI stocks continues to push stocks to new highs, but concerns about narrow market breadth and expensive valuations remain.
#6 - US-China Trade Agreements
President Trump and Xi held a wide-ranging meeting this week that yielded several headline agreements. The US will reduce tariffs on Chinese imports and suspend a planned 100% tariff, while China agreed to pause its rare earth export controls for one year. The deal is structured as a one-year arrangement, with annual reviews and potential renewal, and both leaders confirmed visits to each other’s countries.
Implication: The meeting and agreement ease near-term US-China tensions.
Important Disclosures
This material is provided for general and educational purposes only and is not investment advice. Your investments should correspond to your financial needs, goals, and risk tolerance. Please consult an investment professional before making any investment or financial decisions or purchasing any financial, securities, or investment-related service or product, including any investment product or service described in these materials.
Our Insights


