Regional Bank Concerns, Q3 Earnings, Government Shutdown, and China Tensions

Photo Credit: Anshu Ay, Unsplash
Weekly Market Recap for October 24th
This week, markets were volatile as credit concerns, trade tensions, and an unwind of speculative positions weighed on sentiment. The S&P 500 rebounded early after last week’s regional bank selloff but lost momentum after the administration floated new software export controls and US–China tensions flared. Momentum stocks led the decline as investors captured gains, and small caps underperformed, with the Russell 2000 pressured by regional bank stress and trade tensions. Bonds edged higher as Treasury yields fell amid economic uncertainty, the government shutdown, and expectations for a rate cut next week. Commodities were volatile: gold and silver spiked early before reversing lower, while oil rebounded late after hovering near a 4.5-year low. The VIX eased after last week’s spike but remained elevated, reflecting caution across markets.
S&P 500 Index (Last 12 Months)

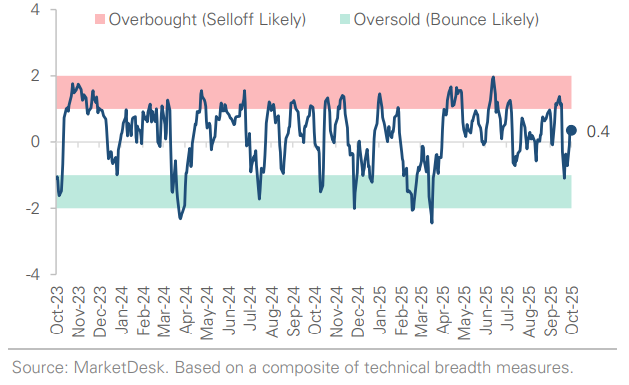
S&P 500 Technical Composite (Last 24 Months)
US Risk Demand Market Indicator
The US Risk Demand Indicator (USRDI) is a quantitative tool to measure real-time investor risk appetite. When the indicator is above zero, it signals a risk-on environment favoring cyclical sectors, high beta stocks, high-yield corporate bonds, and hybrid (convertible) bonds. In contrast, a reading below zero signals a risk-off environment favoring defensive sectors, low-volatility stocks, and US Treasury bonds.
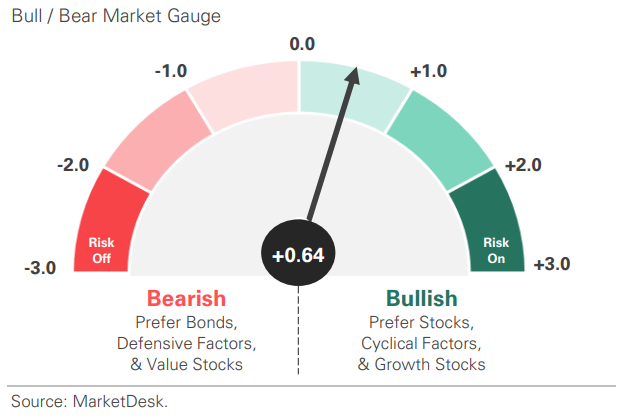
US Market Economic Cycle Indicator
The Market Cycle Indicator tracks two primary investor groups: macro investors and price-based investors. Macro investors rely on fundamental and economic data to guide their decisions, while price-based investors (or technical analysts) focus on price action, momentum, volume, and behavioral trends. The Indicator synthesizes these perspectives to identify the prevailing market regime.

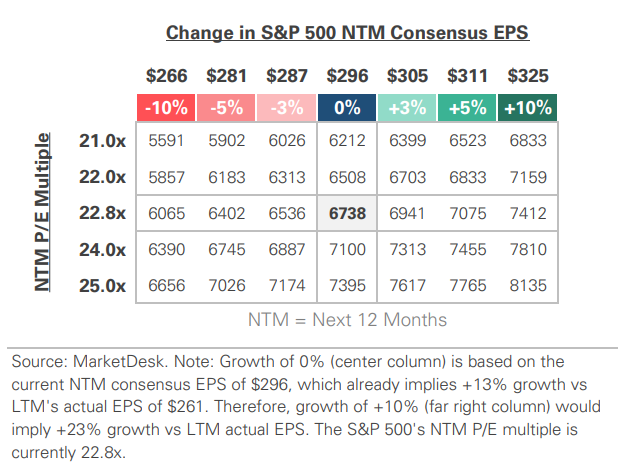
S&P 500 Valuation Matrix
S&P 500 Forward PE Ratio
The S&P 500 forward price-to-earnings (P/E) ratio is a widely followed valuation metric that compares the index's current level to the projected earnings of its constituent companies over the next 12 months. The indicator implies to investors how much they are paying today for each dollar of expected future earnings.

Key Takeaways
#1 - Regional Bank Stocks Sold Sharply
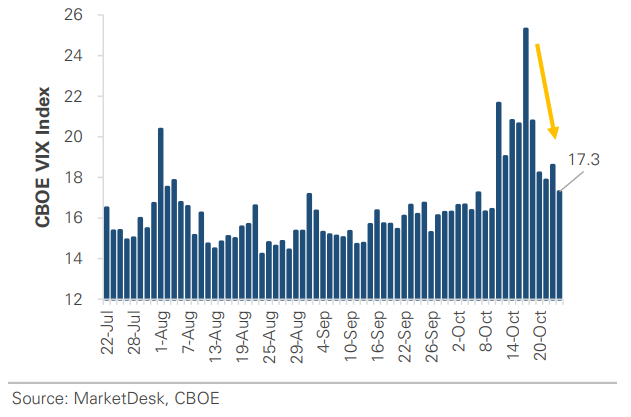
Late last week, regional bank stocks sold off sharply after high-profile reports of credit losses and fraud tied to commercial real estate loans. The headlines came only a few weeks after multiple auto-sector bankruptcies sparked concerns about credit risk. The KBW Regional Banking Index plunged over -6%, its worst single-day drop since April, while the VIX volatility index spiked to a 4-month high.
Implication: The credit-related headlines amplified concerns over the health of regional banks and could signal emerging cracks in the financial system.
Regional Banks and BDCs Selloff

Volatility Eases After Regional Bank Selloff
#2 - Credit Concerns Easing
Credit concerns eased this week as banks released actual Q3 earnings showing healthy underlying credit quality and low loan charge-offs. Wall Street analysts characterized the prior week's incidents as isolated rather than systemic, and regional bank stocks stabilized, recovering a portion of their losses.
Implication: While the immediate panic subsided, the episode exposed several concerns. Regional banks have significant exposure to commercial real estate and the private credit market, where transparency is limited. Fraud allegations suggest poor due diligence, and the increasing use of loan extensions could be masking stress.
#3 - Earnings Season Is Busy
This was one of the busiest earnings weeks of the quarter. With ~25% of S&P 500 companies reporting, ~85% have beaten earnings estimates and ~84% have beaten sales estimates. Both are well above historical averages, which is notable given the upward revisions to earnings estimates throughout the quarter. The blended earnings growth rate for Q3 is tracking between +8.5% and +9.0% year-over-year, compared to the +7.9% estimate entering earnings season.
Implication: It is still early, but Q3 is off to a strong start. If the pace continues, it would mark the ninth consecutive quarter of earnings growth.
#4 - Government Shutdown
The government shutdown reached its 23rd day, making it the second longest after 2018. Progress toward reopening remains limited, and the effects are mounting, with federal workers missing paychecks and key government functions being delayed. The most notable interruption: economic data releases.
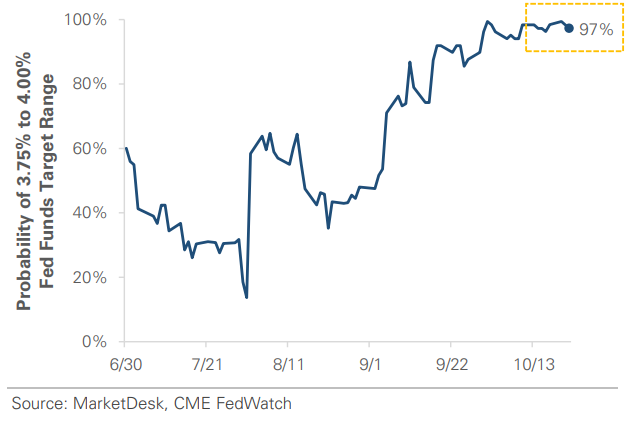
Implication: The Fed is operating blind heading into next week's meeting, though markets are still pricing in a 97% chance of a -0.25% rate cut.
Markets Price in a 0.25% Rate Cut Next Week
#5 - China Trade Tensions
China trade tensions flared again this week after the administration signaled potential export controls on software. Treasury Secretary Bessent said “everything is on the table,” while a planned Trump-Xi meeting later this month remains uncertain. Markets are on edge ahead of a November 1 deadline, when Trump has threatened 155% tariffs unless a deal is reached. Meanwhile, the administration imposed sanctions on Russia’s two largest oil producers, causing oil to surge +5%.
Implication: Trade tensions and sanctions have reintroduced geopolitical risk.
Oil Surges After New Russian Sanctions

#6 - Markets Are Active
The Dow hit a record high, driven by strong Q3 earnings from 3M, Coca-Cola, and GM. Meme stock mania resurfaced, with Beyond Meat spiking over +900% on a retail-driven short squeeze. The 10-year Treasury yield dropped to a 52-week low amid rising expectations for a rate cut on October 29. Gold and silver surged to record highs before reversing sharply, while oil hovered near a 4.5-year low amid oversupply concerns before surging as fresh Russian sanctions were imposed.
Implication: Markets are digesting a mix of catalysts, from a government shutdown and economic data blackout to Q3 earnings and geopolitical risk.
Dow Jones Hits Record High on Strong Q3 Earnings

Gold and Silver Surge Early But Suffer Steep Reversals

Important Disclosures
This material is provided for general and educational purposes only and is not investment advice. Your investments should correspond to your financial needs, goals, and risk tolerance. Please consult an investment professional before making any investment or financial decisions or purchasing any financial, securities, or investment-related service or product, including any investment product or service described in these materials.
Our Insights


