Middle East Update, Stocks Set New Highs, Tech Q1 Earnings, and Q1 GDP Growth

Photo Credit: Getty Images, Unsplash
Weekly Market Recap for May 8th
This week, Markets traded higher for a sixth consecutive week, extending the rally that began in late March and pushing several major indexes to new highs. Technology and growth stocks led the advance. The Nasdaq gained nearly +4%, outpacing the S&P 500 and small-cap stocks, which each rose around +1.5%. The top-performing sectors were technology, consumer discretionary, and communication services, all of which carry significant exposure to the largest companies in the market. Beneath the surface, the picture was mixed: seven of eleven sectors finished the week lower, highlighting how the rally has been driven by a relatively narrow group of market leaders. Bonds produced modest gains as interest rates drifted lower, and oil fell more than -8% on reports of progress toward an Iran deal.
S&P 500 Index (Last 12 Months)
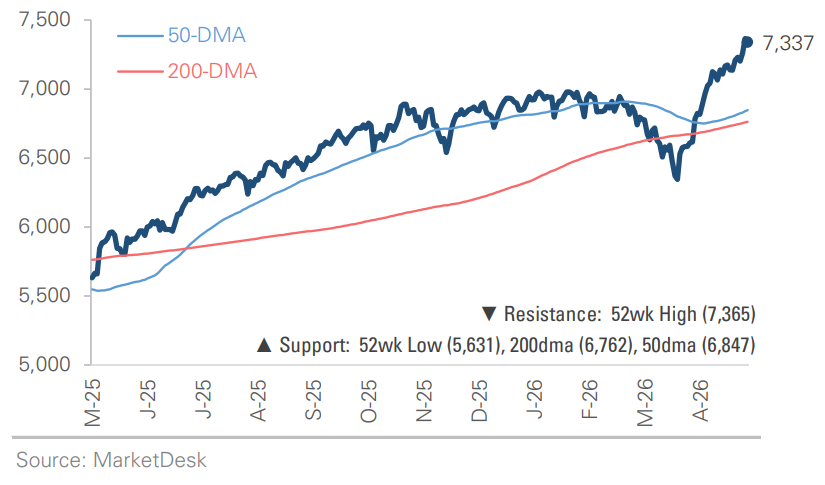
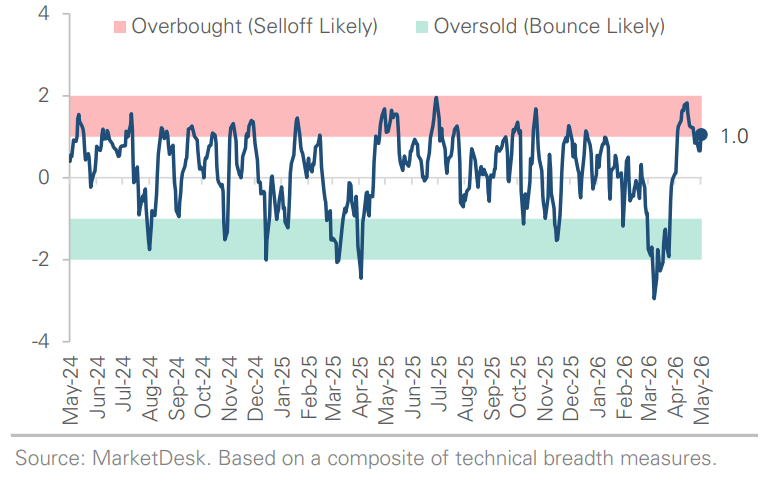
S&P 500 Technical Composite (Last 24 Months)
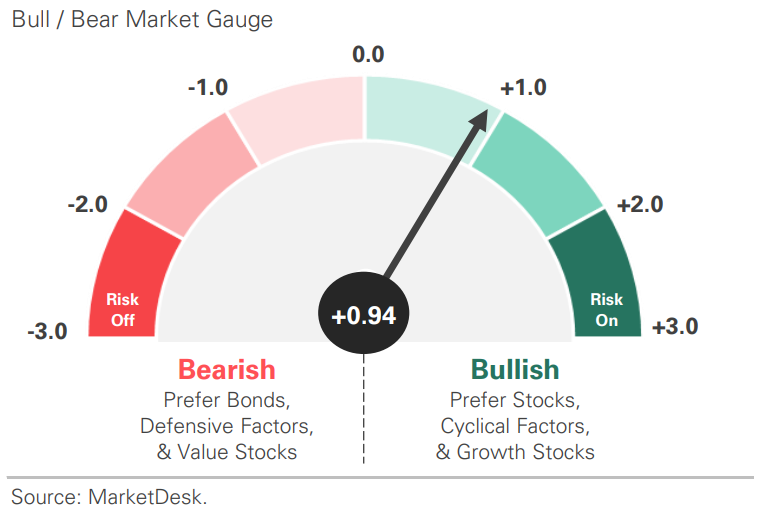
US Risk Demand Market Indicator
The US Risk Demand Indicator (USRDI) is a quantitative tool to measure real-time investor risk appetite. When the indicator is above zero, it signals a risk-on environment favoring cyclical sectors, high beta stocks, high-yield corporate bonds, and hybrid (convertible) bonds. In contrast, a reading below zero signals a risk-off environment favoring defensive sectors, low-volatility stocks, and US Treasury bonds.
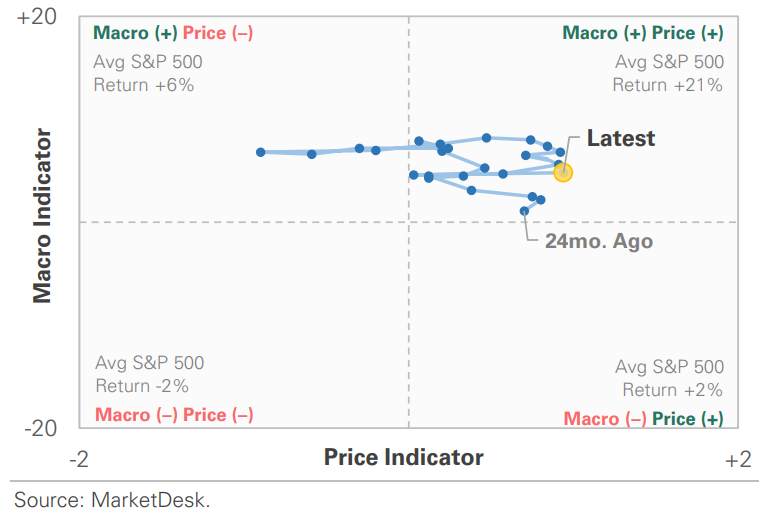
US Market Economic Cycle Indicator
The Market Cycle Indicator tracks two primary investor groups: macro investors and price-based investors. Macro investors rely on fundamental and economic data to guide their decisions, while price-based investors (or technical analysts) focus on price action, momentum, volume, and behavioral trends. The Indicator synthesizes these perspectives to identify the prevailing market regime.
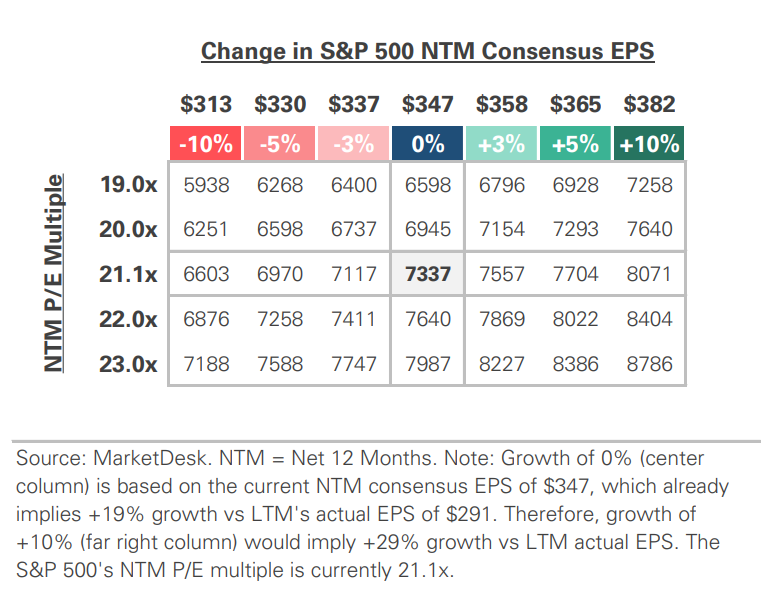
S&P 500 Valuation Matrix
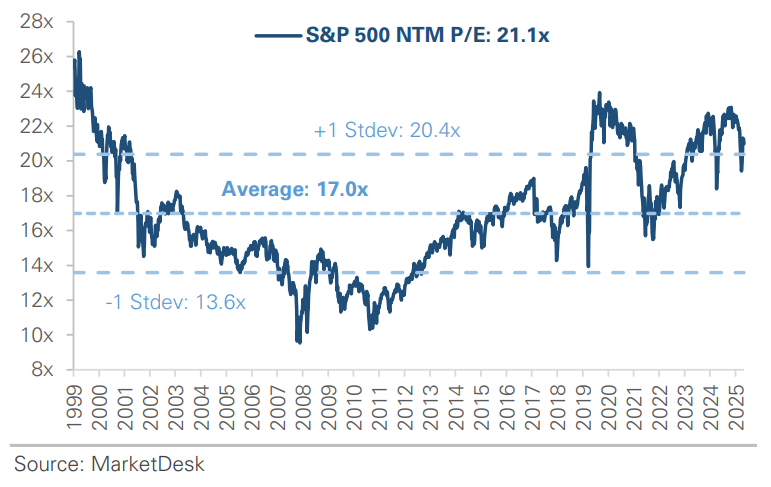
S&P 500 Forward PE Ratio
The S&P 500 forward price-to-earnings (P/E) ratio is a widely followed valuation metric that compares the index's current level to the projected earnings of its constituent companies over the next 12 months. The indicator implies to investors how much they are paying today for each dollar of expected future earnings.
Key Takeaways
#1 - Middle East
The Middle East conflict, now in its 10th week, remains the top story in financial markets. The week opened with Iran’s most serious provocation since the April ceasefire, including strikes on the UAE and attacks on commercial ships in the Strait of Hormuz. The tone shifted quickly as regional allies pressed for de-escalation and reports emerged of a framework agreement to end the conflict. Oil fell nearly -10% early in the week, trading near $90 per barrel for the first time since mid-April.
Implication: The acute stress from earlier in the conflict has eased, but the conflict and related geopolitical headlines continue to impact financial markets.
#2 - U.S. Stocks Extend Rally
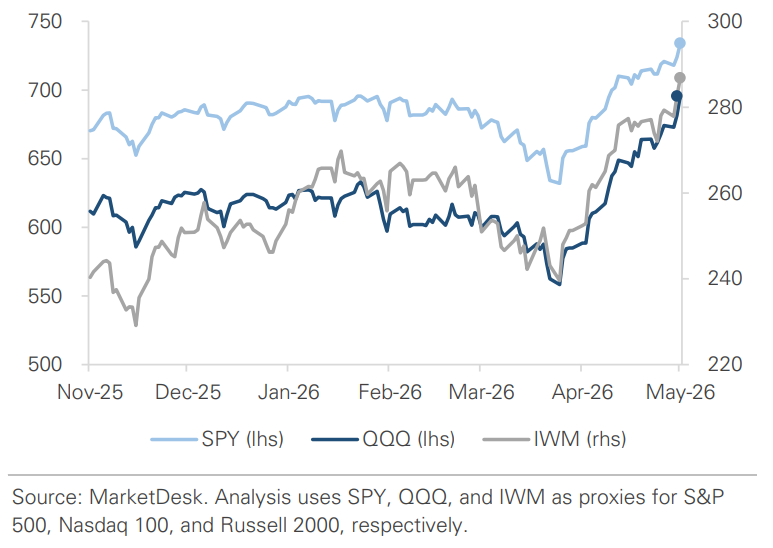
U.S. stocks extended their rally to six consecutive weeks, with three of the four major indexes hitting new highs. The S&P 500 gained +2%, the Nasdaq rose +4%, and the Russell 2000 rose +1.5% as small-cap stocks set a new high. The advance came despite another volatile stretch of conflict-related headlines, with most of the week’s gains concentrated in a single session after reports of an Iran deal.
Implication: The pattern has been consistent: geopolitical headlines create short bursts of volatility, but the market rebounds as the volatility fades.
Major Equity Indexes Continue to Set New Highs
#3 - U.S. Tech Companies Report Earnings
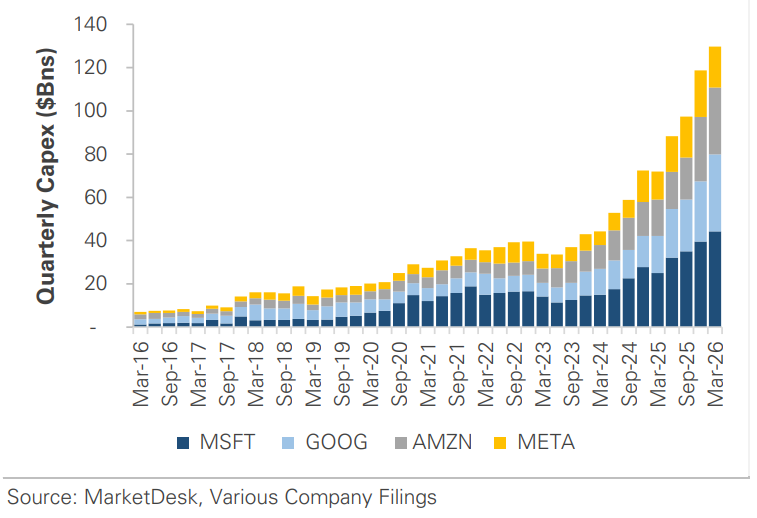
The largest tech companies reported earnings over the past two weeks, and the scale of their AI infrastructure spending continues to accelerate. Alphabet, Amazon, Meta, and Microsoft all beat estimates, but the capex figures stood out. Meta raised its full-year capital spending guidance to $125-145 billion, up from $115-135 billion. Microsoft spent nearly $32 billion in a single quarter, and Alphabet’s cloud backlog nearly doubled. Combined, the top four U.S. cloud providers are projected to spend over $660 billion on infrastructure in 2026.
Implication: The spending is less speculative than it once seemed, and the group continues to post strong revenue growth. Given these companies’ large index weights, the reported growth is one of the forces pushing broad market indexes higher.
Tech Companies Continue to Increase AI Capex
#4 - U.S. Economy Grows
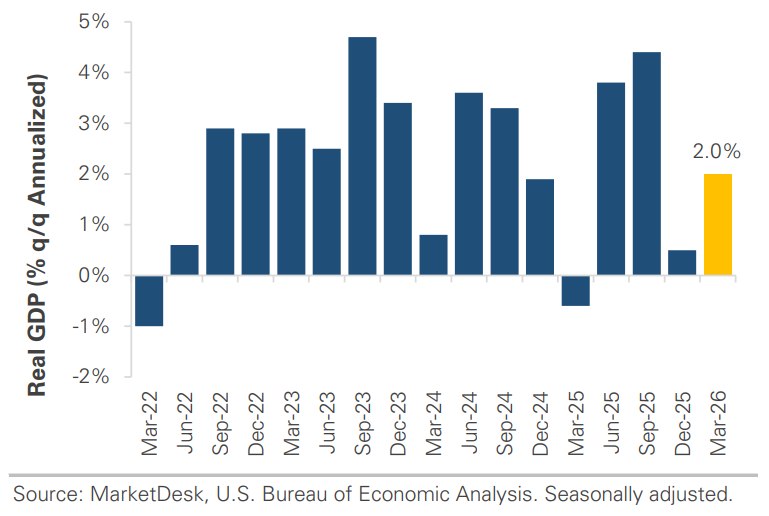
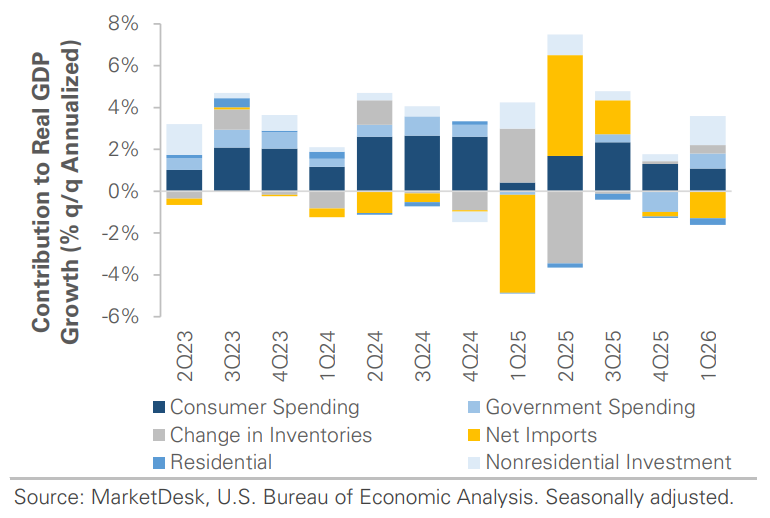
The U.S. economy grew at a +2.0% annualized rate in Q1, rebounding from the +0.5% pace in Q4 when the government shutdown weighed on activity. The recovery was broad. Business investment led the way, with strength in equipment and software tied to the AI infrastructure buildout. Inventory restocking and a rebound in government spending after the shutdown also contributed, and while the pace of growth slowed from Q4, consumer spending increased.
Implication: The economy showed resilience in Q1, which included the first month of the conflict. The question for Q2 is whether the conflict is starting to impact the economy and whether inflation pressures are building as energy costs remain high.
Economic Growth Rebounds in Q1 2026
Contribution to Q1 2026 Growth
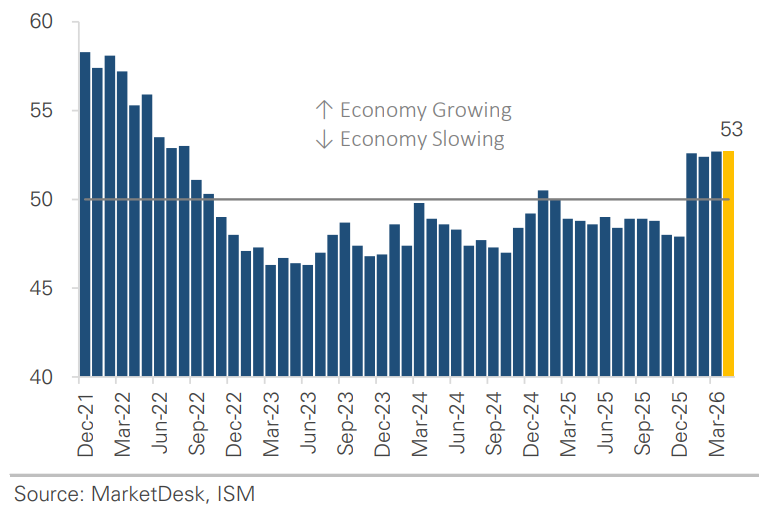
Manufacturing Survey Continues to Signal Expansion
#5 - Federal Reserve Holds Rates Steady
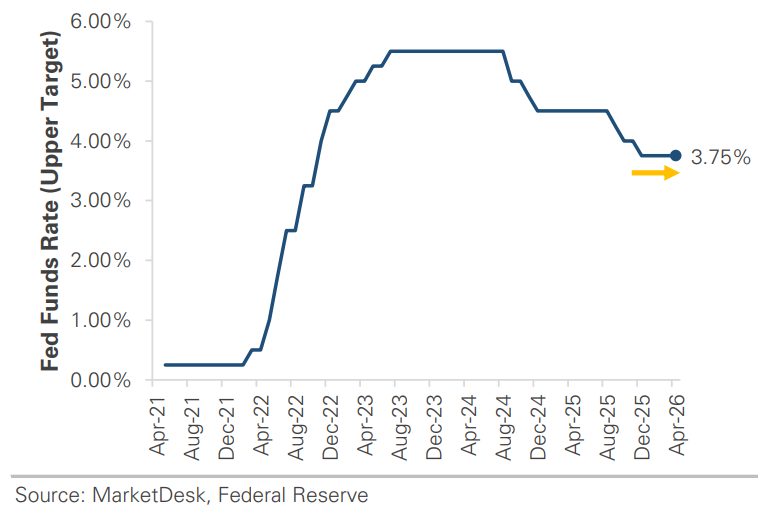
The Federal Reserve held rates steady at 3.50-3.75% in April, but the vote revealed a divided committee. Four members dissented, the most since the early 1990s. Three preferred to remove the easing bias from the statement, while one voted for an immediate rate cut. The split reflects a debate about how to weigh competing signals: an economy that continues to grow, an oil shock that is pushing inflation higher, and a stable labor market. The statement acknowledged the uncertainty, citing developments in the Middle East that could affect inflation.
Implication: Rate cuts are not on the horizon. Market pricing shows no change expected through the end of 2026, with only a modest probability of a cut later in the year.
Fed Holds Interest Rates Steady in April
Important Disclosures
This material is provided for general and educational purposes only and is not investment advice. Your investments should correspond to your financial needs, goals, and risk tolerance. Please consult an investment professional before making any investment or financial decisions or purchasing any financial, securities, or investment-related service or product, including any investment product or service described in these materials.
Our Insights


