Q2 GDP, July Jobs Report, and Magnificent 7 Earnings

Photo Credit: Kristaps Ungurs, Unsplash
Weekly Market Recap for August 8th
This week, mega-cap stocks led with the Growth factor, and the Nasdaq index outperformed the S&P 500, while the Equal Weight S&P 500 underperformed. International equities outperformed U.S. equities, with developed and emerging markets outperforming the S&P 500 by nearly +2% as the U.S. dollar weakened. Bonds traded higher as Treasury yields rallied after a weak July jobs report, with the front end of the curve falling the most. Long-duration Treasury bonds and corporate investment grades outperformed as yields fell, while corporate high-yield credit spreads widened due to concerns of slowing economic growth. Commodities were mixed, with crude falling sharply on growth concerns, while gold traded higher. Volatility expectations rose, with the VIX rising to mid-June levels before retreating.
S&P 500 Index (Last 12 Months)

S&P 500 Technical Composite (Last 24 Months)

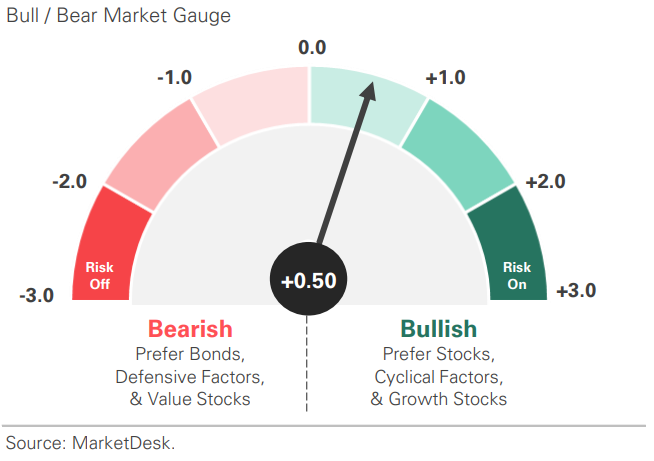
US Risk Demand Market Indicator
The US Risk Demand Indicator (USRDI) is a quantitative tool to measure real-time investor risk appetite. When the indicator is above zero, it signals a risk-on environment favoring cyclical sectors, high beta stocks, high-yield corporate bonds, and hybrid (convertible) bonds. In contrast, a reading below zero signals a risk-off environment favoring defensive sectors, low-volatility stocks, and US Treasury bonds.
US Market Economic Cycle Indicator
The Market Cycle Indicator tracks two primary investor groups: macro investors and price-based investors. Macro investors rely on fundamental and economic data to guide their decisions, while price-based investors (or technical analysts) focus on price action, momentum, volume, and behavioral trends. The Indicator synthesizes these perspectives to identify the prevailing market regime.

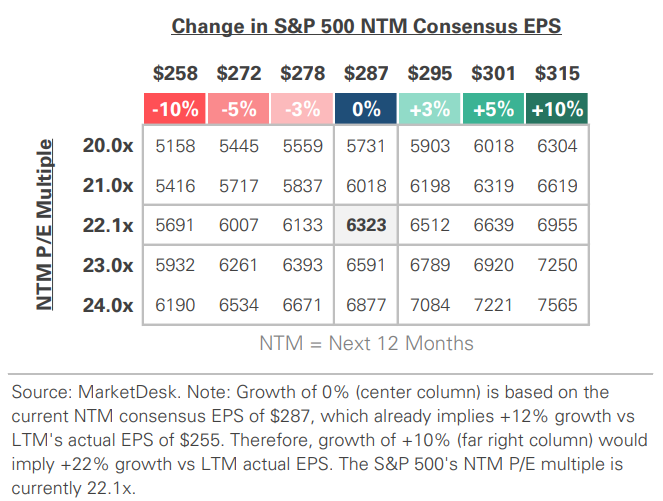
S&P 500 Valuation Matrix
Key Takeaways
#1 - Major Economic Shifts
The first half of 2025 saw sharp economic whiplash, with GDP swinging from –0.5% in Q1 to +3.0% in Q2. Most of the reversal came from temporary trade and inventory distortions linked to tariffs. In Q1, a wave of imports weighed on growth as businesses frontloaded purchases ahead of tariffs. Imports then slowed in Q2, artificially boosting GDP as the trade deficit narrowed. Inventory trends also flipped: stockpiling added to Q1 growth, but inventory drawdowns weighed on growth in Q2. Beneath these swings, core economic activity weakened. Real final sales to private domestic purchasers, which exclude volatile categories such as imports, government spending, and inventories, slowed to +1.2% in Q2 from +1.9% in Q1, the lowest since early 2023.
Implication: Headline economic growth rebounded, but core economic activity has slowed compared to 2024.
GDP Growth Rebounds in Q2 as Net Imports Normalize
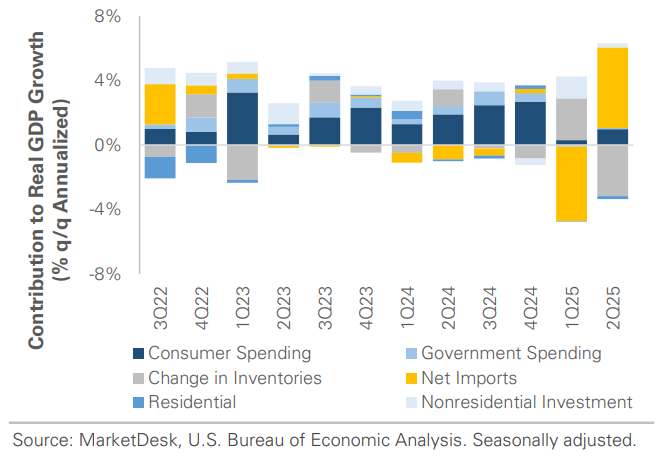
Core GDP Growth Slows for 3rd Consecutive Quarter

#2 - Labor Market Slowdown
The July jobs report revealed a slowdown in the labor market. Payrolls rose +73,000, and prior estimates for May and June were revised by -258,000, dragging the 3-month average down to +35,000. Nearly all of July’s gains came from health care and social assistance, while other major private industries and the federal government were flat or negative. The unemployment rate rose to 4.2%, and the number of long-term unemployed (>27 weeks) rose to 1.8 million, the highest since Q4 2021.
Implication: The data shows a labor market near stall speed, giving the Fed room to cut as early as September if the trend holds.
Job Growth Slowed the Past 3 Months

Number of Long-Term Unemployed Rose

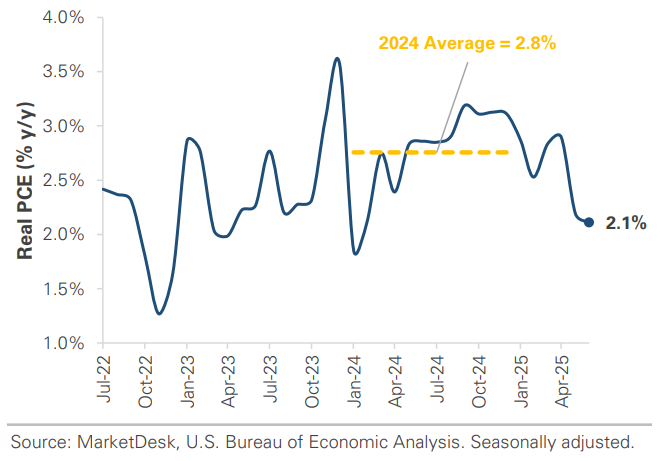
#3 - Consumer Modest Spending Rebound
June’s personal consumption expenditures report showed a modest spending rebound after declines in April and May. However, it also highlighted a broader spending slowdown. Nominal PCE rose +0.3% m/m, but real PCE, which is adjusted for inflation, rose only +0.1%, signaling softer underlying demand. On a quarterly basis, real PCE rose at a +1.4% annualized pace in Q2, roughly half the average in 2024.
Implication: Together with softer real final sales and slower job growth, the data indicates the U.S. expansion is gradually losing steam.
Consumer Spending Slowing from 2024 Levels
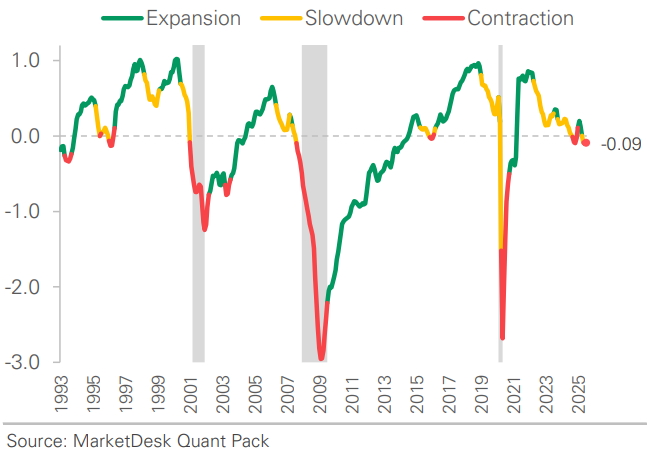
#4 - US Business Cycle Indicator Signals Slowdown
Our US Business Cycle Indicator began signaling a slowdown in late May when it fell into contraction. The slowdown coincided with a rising policy uncertainty and broader macro volatility. The question is what happens next. Economic data strengthened as Q2 progressed and trade uncertainty eased, with consumer spending and manufacturing rebounding in June. Next week, we will provide another data round showing if the June rebound carried over to July.
Implication: Unless domestic demand strengthens, the economy appears set to downshift in 2H 2025.
US Business Cycle Indicator
#5 - Magnificent 7 Earnings
Magnificent 7 earnings delivered a clear message: demand for AI infrastructure is still growing. Cloud growth accelerated, and tech giants such as Microsoft, Amazon, Alphabet, and Meta are responding with increased capex budgets. Nvidia, which reports on August 27th, will likely show hardware supply remains a key bottleneck. As long as AI firms keep investing, the capex cycle should continue to support demand for semiconductors, power infrastructure, and data-center construction.
Implication: AI is becoming a macro driver, not just a tech trend. However, with tech capex so large, any stumble could quickly ripple through a concentrated market trading at high valuations. It is important to balance the upside with high expectations.
Important Disclosures
This material is provided for general and educational purposes only and is not investment advice. Your investments should correspond to your financial needs, goals, and risk tolerance. Please consult an investment professional before making any investment or financial decisions or purchasing any financial, securities, or investment-related service or product, including any investment product or service described in these materials.
Our Insights