

Photo Credit: Mathieu Odin
Weekly Market Recap for October 9th
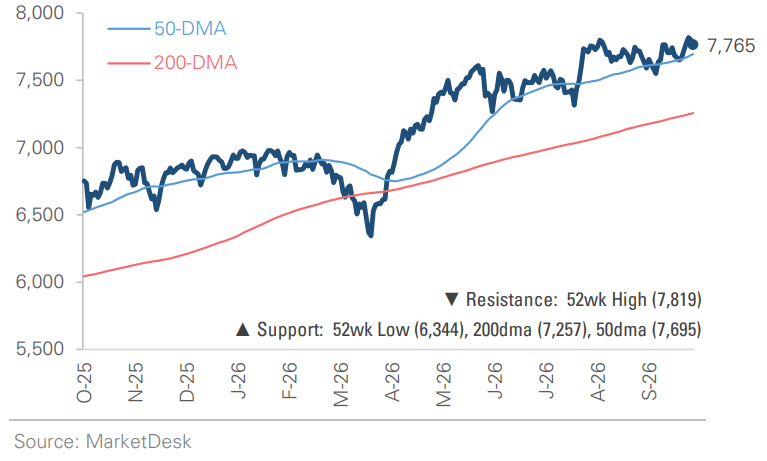
Markets traded higher this week, although performance beneath the major indexes was once again mixed. The S&P 500 gained +1.3%, and the Nasdaq rose +0.7%, while the Russell 2000 small-cap index fell -0.5%. Despite the divergence, market breadth improved, with leadership shifting toward more defensive sectors and value stocks. The Equal-Weight S&P 500 gained +1.4%, and Value (+1.5%) outperformed Growth (+1.1%), despite continued weakness in small caps. Energy (+4.1%) led all sectors despite falling oil prices, followed by Consumer Staples (+3.8%) and Utilities (+3.5%). At the other end, Technology and Industrials were both flat. Bonds posted modest gains as Treasury yields finished the week lower after rising early in the week. The U.S. dollar was flat, oil prices declined -2.2%, and VIX ended the week near 15.
S&P 500 Index (Last 12 Months)
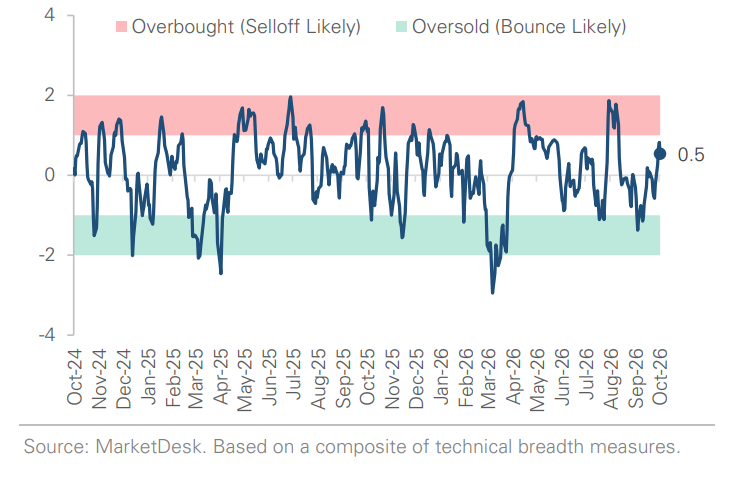
S&P 500 Technical Composite (Last 24 Months)
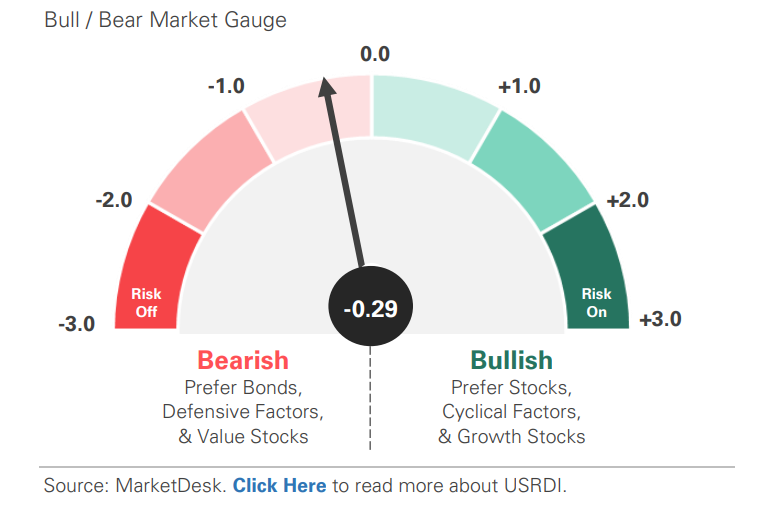
US Risk Demand Market Indicator
The US Risk Demand Indicator (USRDI) is a quantitative tool to measure real-time investor risk appetite. When the indicator is above zero, it signals a risk-on environment favoring cyclical sectors, high-beta stocks, high-yield corporate bonds, and hybrid (convertible) bonds. In contrast, a reading below zero signals a risk-off environment favoring defensive sectors, low-volatility stocks, and US Treasury bonds.
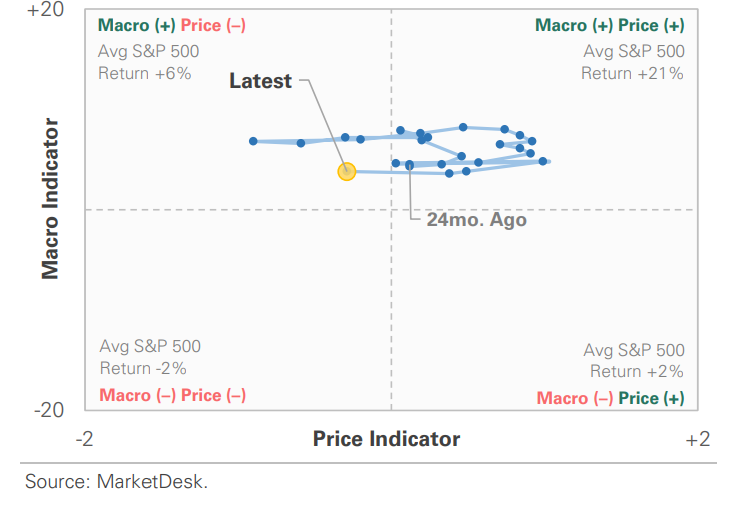
US Market Economic Cycle Indicator
The Market Cycle Indicator tracks two primary investor groups: macro investors and price-based investors. Macro investors rely on fundamental and economic data to guide their decisions, while price-based investors (or technical analysts) focus on price action, momentum, volume, and behavioral trends. The Indicator synthesizes these perspectives to identify the prevailing market regime.
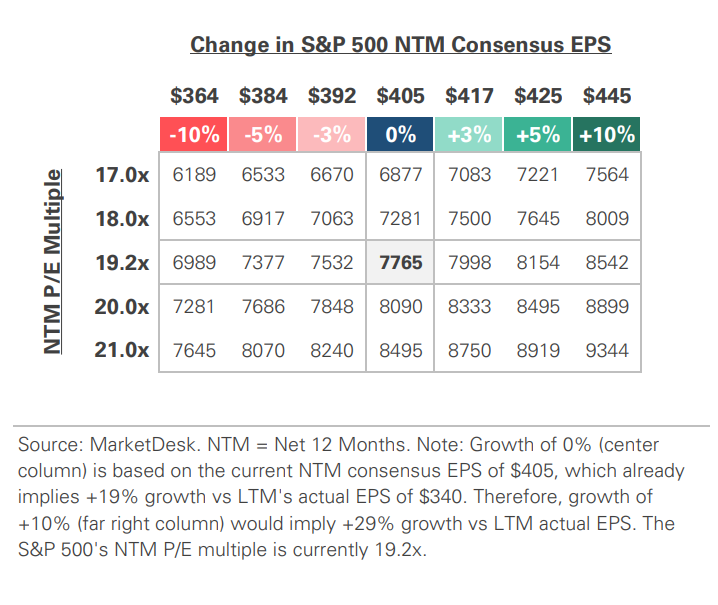
S&P 500 Valuation Matrix
S&P 500 Forward PE Ratio
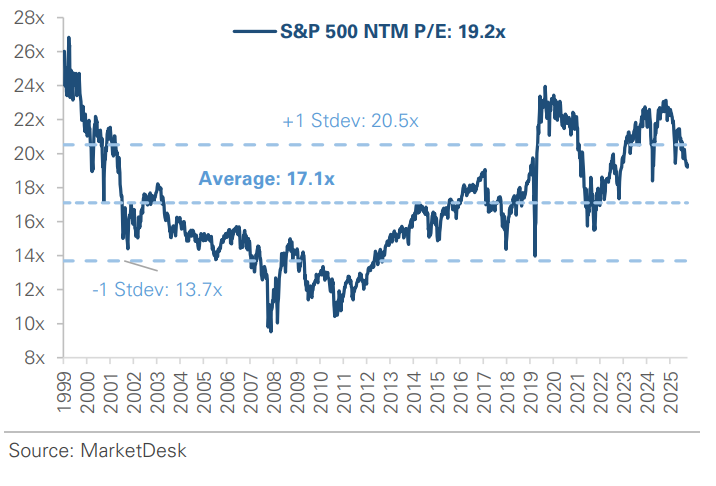
The S&P 500 forward price-to-earnings (P/E) ratio is a widely followed valuation metric that compares the index's current level to the projected earnings of its constituent companies over the next 12 months. The indicator implies to investors how much they are paying today for each dollar of expected future earnings.
Key Takeaways
#1 - Hiring Slows, Labor Market Holds Firm
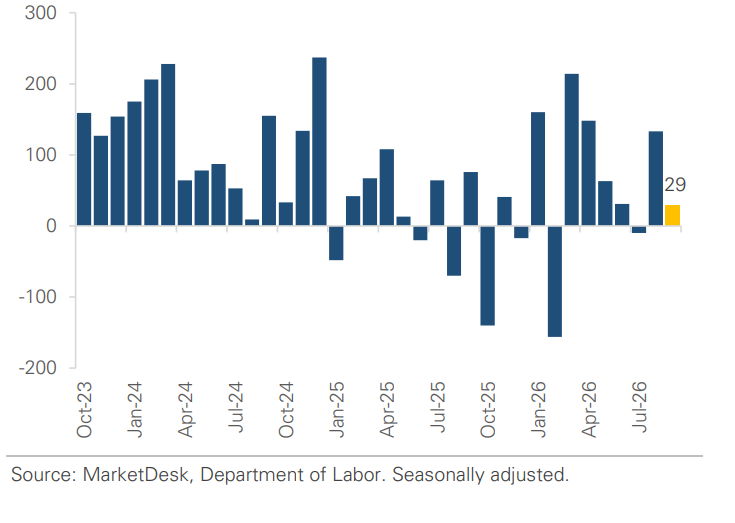
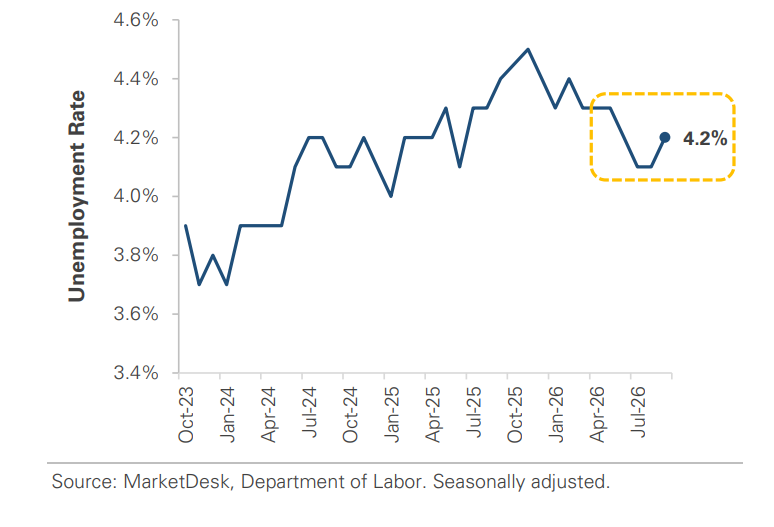
Employers added 29,000 jobs, below the prior-year average monthly gain of 45,000. July payrolls were revised to -10,000 and August to +133,000, reducing the two months by a combined -60,000 jobs. The unemployment rate rose +0.1% to 4.2%, while initial jobless claims remain near 200k, a very low level by historical standards. The recent data point to slower and more volatile hiring rather than a sharp increase in layoffs.
Implication – The labor market has cooled, but so far, the impact has been slower hiring rather than widespread job losses.
Job Growth Remains Volatile
Unemployment Remains Relatively Low
#2 - Services Strength Meets Inflation Pressure
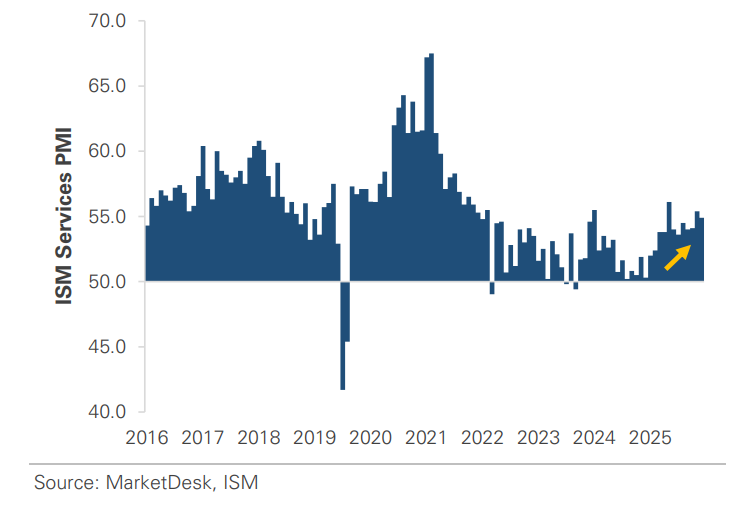
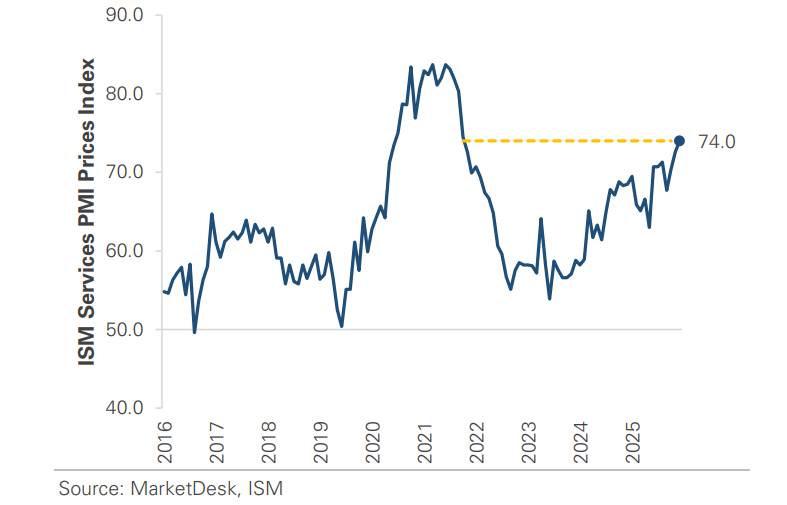
The ISM Services PMI ticked down from 55.4 to 54.9 but stayed comfortably above the 50 expansion threshold. New orders remained strong, while the employment index returned to expansion. The Prices Index rose to 74.0, its highest reading since July 2022.
Implication – The data suggests the services side of the economy remains strong, although elevated business costs remain an important part of the inflation picture
Services Activity Maintains Expansion
Services Growth Persists as Costs Climb
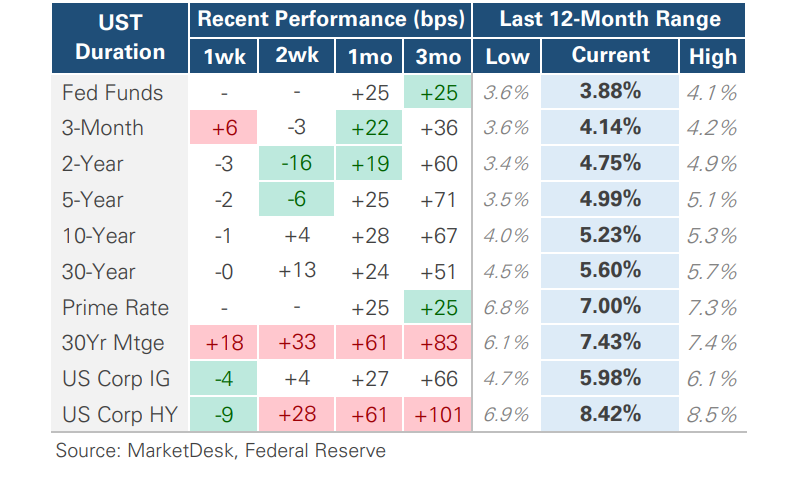
#3 - Treasury Yields Diverge From Fed Expectations
Prices for goods imported into the U.S. increased +1.1% for the month and +8.1% over the past year. Higher fuel prices contributed to the increase, but import prices excluding fuel also rose +0.7%. In addition, prices received by U.S. exporters increased +2.2% for the month and +11.6% over the past year. These figures reflect prices paid and received in international trade, not prices charged directly to consumers.
Implication – The report adds a business-level perspective to last week’s consumer and producer inflation data, providing further evidence of the breadth of September’s price increases.
Long-Term Yields Reach Multidecade Highs
#4 - Record Highs Conceal Narrow Leadership
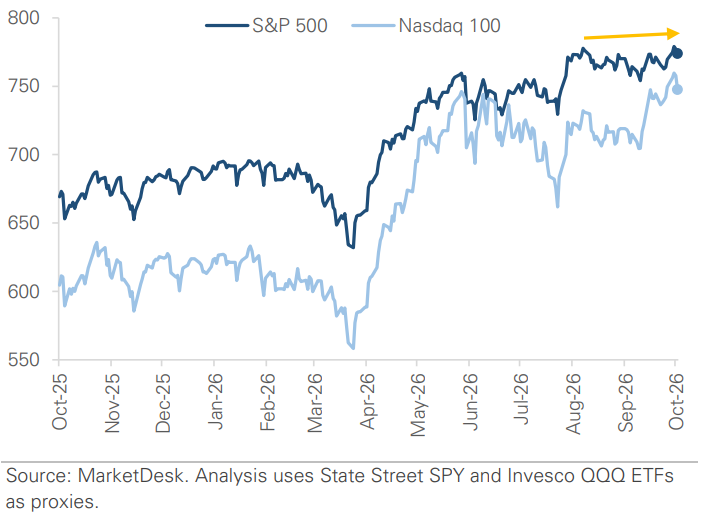
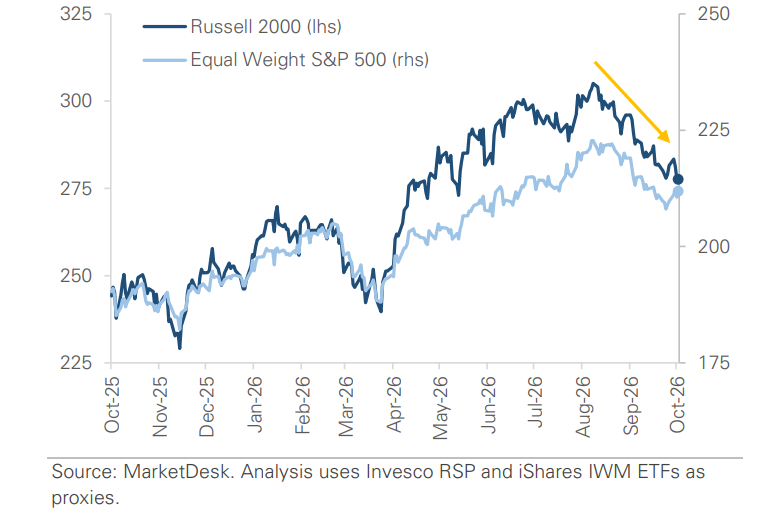
The S&P 500 and Nasdaq reached new highs this week, while the Russell 2000 is nearly -9% below its August high and the equal-weight S&P 500 continues to lag its market-cap-weighted counterpart. Higher interest rates have weighed more heavily on smaller companies and other rate-sensitive areas of the market, while strength among the largest technology companies has supported the headline indexes.
Implication – The divergence shows that this year’s index gains have become increasingly concentrated, with the largest companies holding up better than the broader market as interest rates rise.
S&P 500 & Nasdaq Set New All-Time Highs
Equal Weight & Small Caps Trade Lower
#5 - Inflation and Earnings Take Center Stage
Investors will receive September consumer inflation data on Wednesday, followed by producer inflation and retail sales on Thursday, and industrial production on Friday. Those reports will provide updated readings on inflation, consumer spending, and manufacturing after a week that produced mixed economic signals. Next week also marks the unofficial start of Q3 earnings season, with major Wall Street banks reporting. Investors will watch lending, credit quality, trading, and deal activity, along with what executives see across businesses and consumers.
Implication – Together, the economic releases and bank earnings should provide a broader look at inflation, consumer demand, credit conditions, and business activity
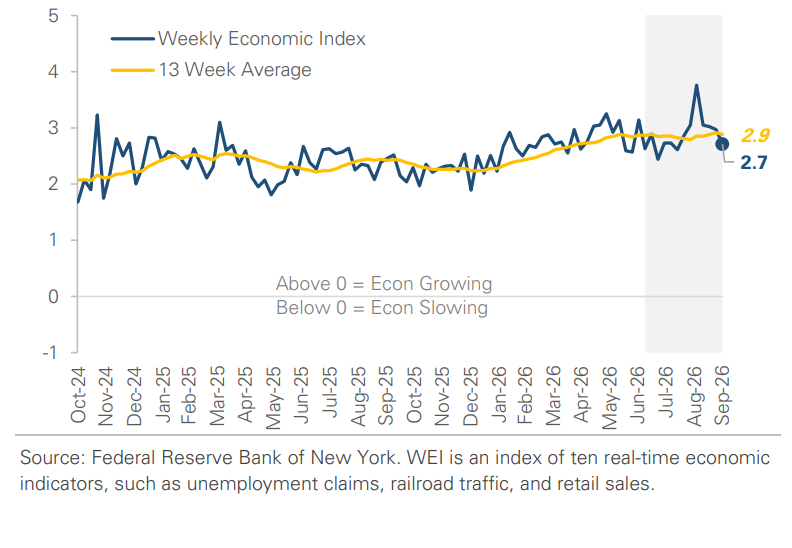
Tracking the Economy’s Underlying Momentum
Important Disclosures
This material is provided for general and educational purposes only and is not investment advice. Your investments should correspond to your financial needs, goals, and risk tolerance. Please consult an investment professional before making any investment or financial decisions or purchasing any financial, securities, or investment-related service or product, including any investment product or service described in these materials.
Our Insights