

Photo Credit: Jezael Melgoza
Weekly Market Recap for October 2nd
Markets were mixed this week, with rising long-term Treasury yields weighing on bonds and the broader equity market. The S&P 500 fell -0.3%, the Nasdaq gained +0.2%, and the Russell 2000 small-cap index declined -0.9%. Growth (+0.2%) outperformed Value (-1.0%), while the equal-weight S&P 500 fell -0.6%. Technology led all sectors, gaining +1.7%, while nine of the remaining ten sectors declined. Bonds posted mixed results as interest rates diverged by maturity. Higher long-term Treasury yields weighed on longer-maturity bonds, with 20+ year Treasuries falling -1.8%, while shorter-maturity Treasuries gained +0.3%. Corporate bonds also declined as yields rose and credit spreads widened. The U.S. dollar strengthened +0.7%, oil fell -1.6%, and bond market volatility continued to increase.
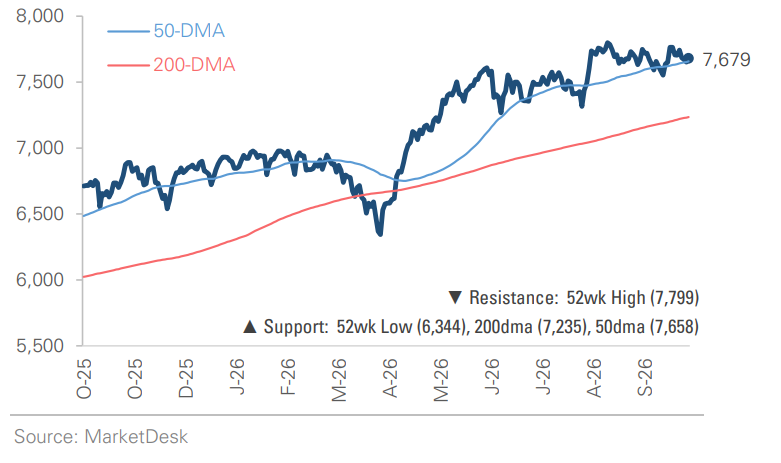
S&P 500 Index (Last 12 Months)
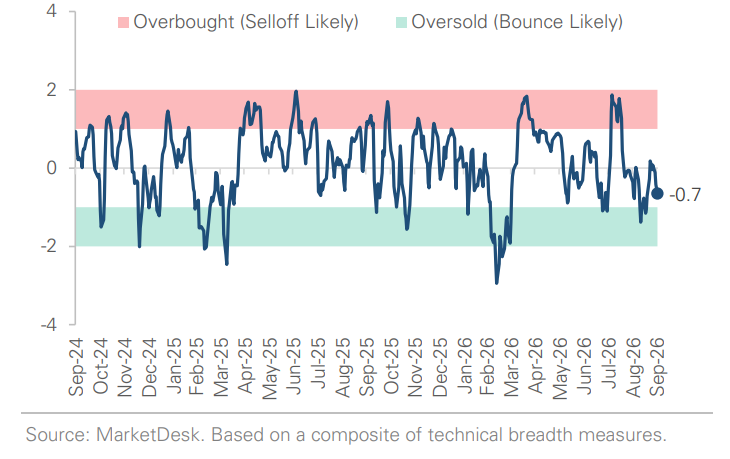
S&P 500 Technical Composite (Last 24 Months)
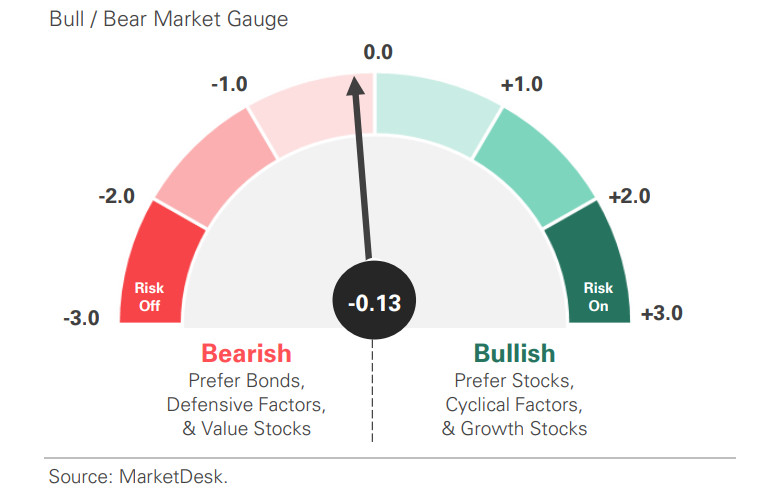
US Risk Demand Market Indicator
The US Risk Demand Indicator (USRDI) is a quantitative tool to measure real-time investor risk appetite. When the indicator is above zero, it signals a risk-on environment favoring cyclical sectors, high-beta stocks, high-yield corporate bonds, and hybrid (convertible) bonds. In contrast, a reading below zero signals a risk-off environment favoring defensive sectors, low-volatility stocks, and US Treasury bonds.
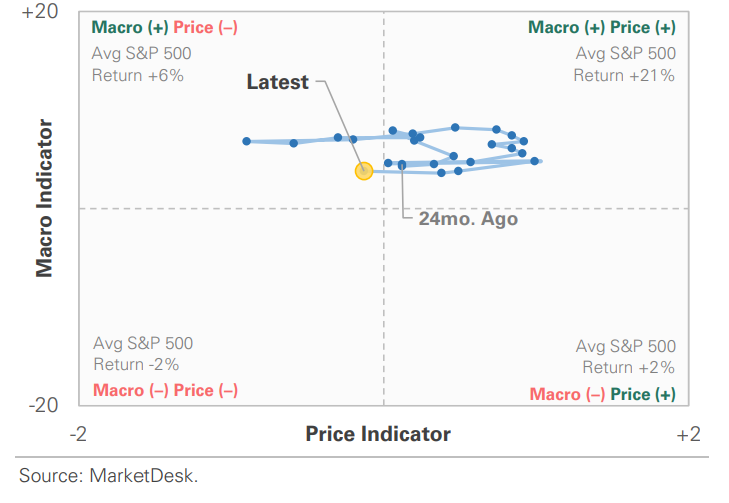
US Market Economic Cycle Indicator
The Market Cycle Indicator tracks two primary investor groups: macro investors and price-based investors. Macro investors rely on fundamental and economic data to guide their decisions, while price-based investors (or technical analysts) focus on price action, momentum, volume, and behavioral trends. The Indicator synthesizes these perspectives to identify the prevailing market regime.
S&P 500 Valuation Matrix
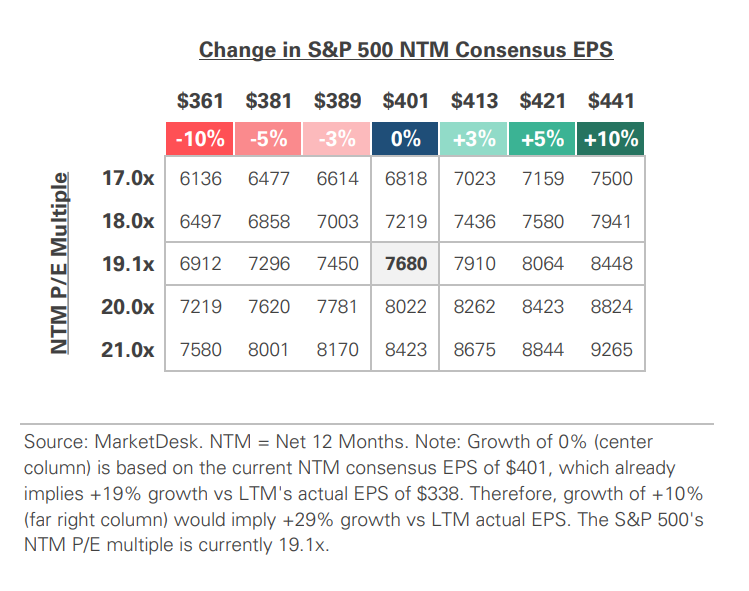
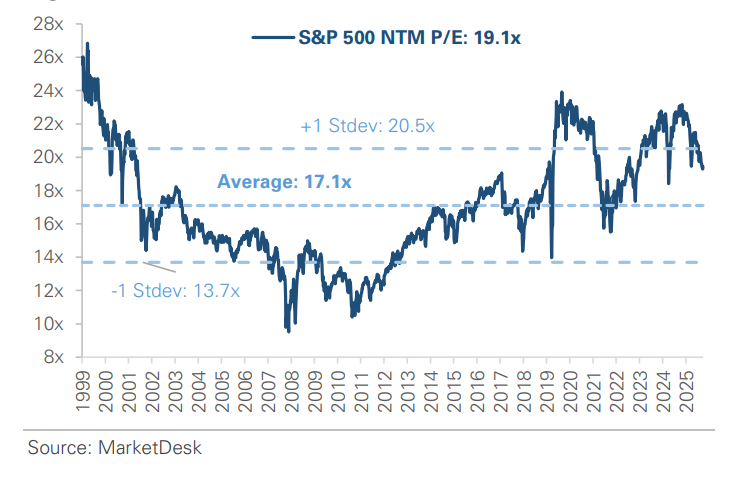
S&P 500 Forward PE Ratio
The S&P 500 forward price-to-earnings (P/E) ratio is a widely followed valuation metric that compares the index's current level to the projected earnings of its constituent companies over the next 12 months. The indicator implies to investors how much they are paying today for each dollar of expected future earnings.
Key Takeaways
#1 - Economic Growth Revised Higher
Q2 GDP growth was revised up to +2.2% annualized from +1.5% initially reported, while Q1 growth was revised up to +2.5% from +2.1%. Underlying demand was even stronger: consumer spending and private fixed investment rose +4.6% in the second quarter, the fastest pace since early 2023. The upward revisions reflected stronger consumer spending and business investment.
Implication – The updated figures show that the economy entered the second half with considerably more momentum than the earlier estimates suggested.
Stronger Economic Growth
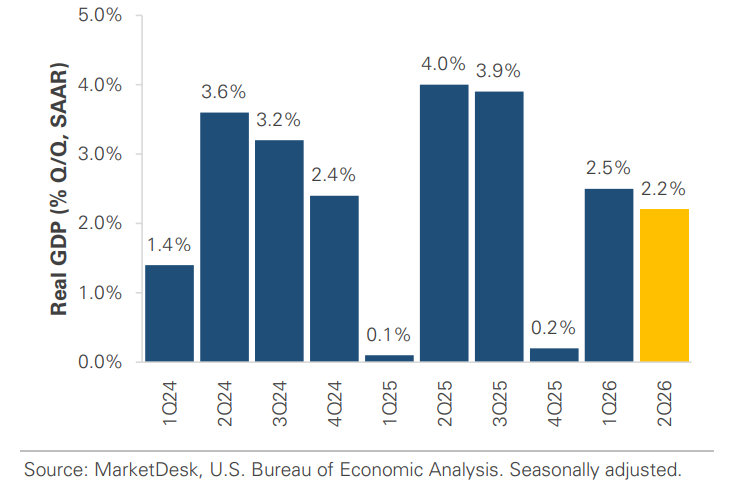
Quarter/Quarter, SAAR-Seasonally Adjusted Annual Rate
#2 - Consumer Spending Stays Strong
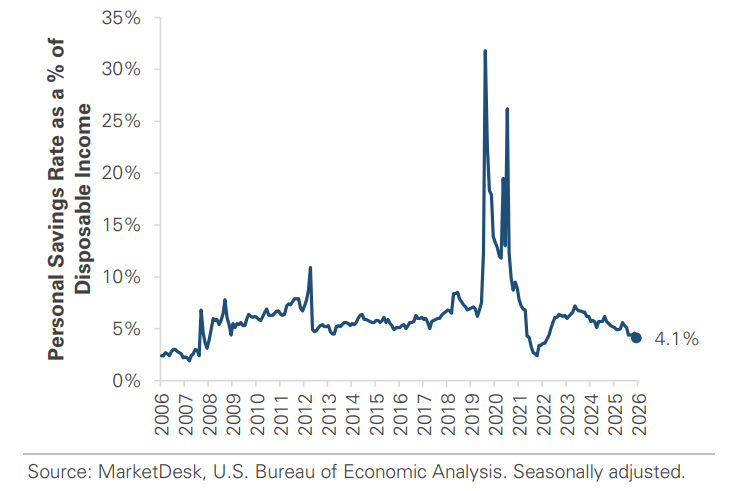
Personal consumption expenditures rose +0.9% in August, with spending up +0.6% after inflation. However, personal income rose only +0.2%, and after-inflation disposable income remained unchanged. Consumers narrowed the gap by saving less, with the personal savings rate falling to 4.1% from 4.6% in July.
Implication – Consumer spending remains strong despite weak confidence, but August's gains relied partly on households saving less as spending grew faster than income.
Consumer Spending Rebounds in August
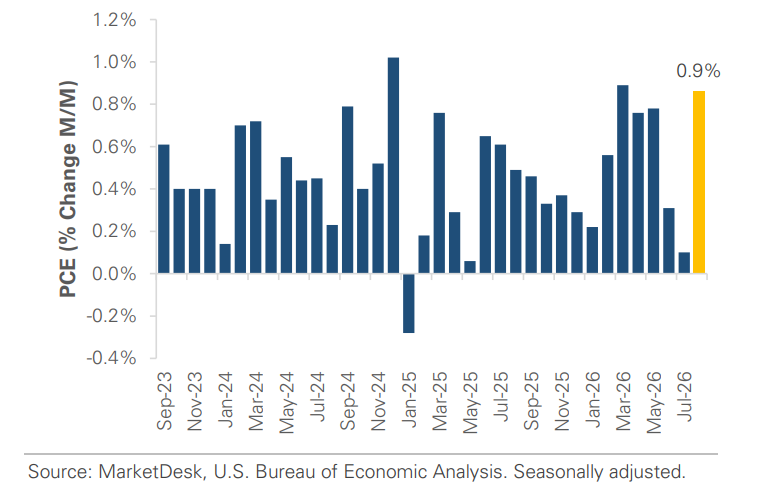
Consumers Spend More, Save Less
#3 - AI Investment Fuels Growth
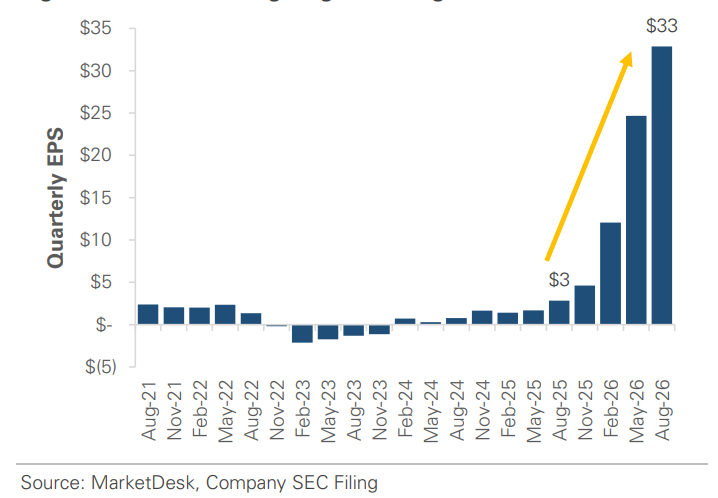
Business investment remained strong in Q2, with continued spending on computing equipment, software, and other intellectual property. Micron's latest earnings provided a fresh look at the scale of the buildout. Quarterly revenue hit a record $54.2 billion as demand from cloud and data center customers rose sharply, and the company projected roughly $61.5 billion in revenue for the current quarter.
Implication – The AI boom is increasingly visible across the broader economy, with spending on the infrastructure needed to build and run AI systems driving strong investment growth.
AI Demand Fuels Micron’s Earnings Surge
#4 - Treasury Yields Keep Climbing
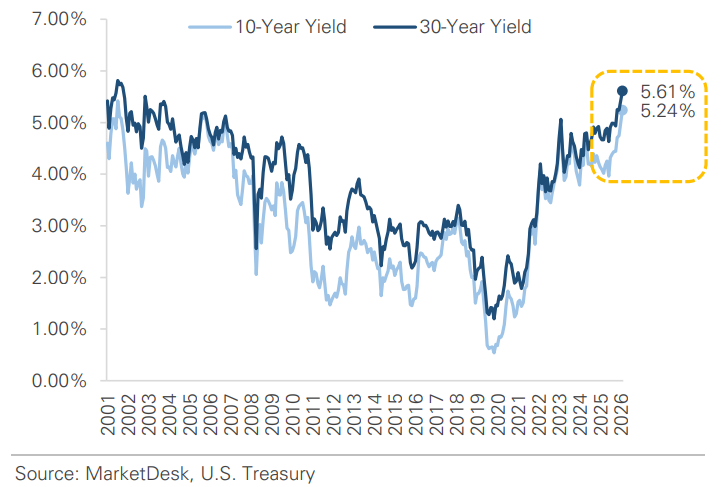
The 10-year Treasury yield rose above 5.30%, while the 30-year yield approached 5.70%. Both yields now sit at their highest levels since 2002. Stronger economic growth helps explain some of the upward pressure, but persistent inflation, heavy government borrowing, and broader global bond-market weakness have also driven higher long-term rates. Shorter-term yields were steadier this week, underscoring that the move is about more than expectations for the next Federal Reserve decision.
Implication – Rising long-term rates are tightening financial conditions by raising borrowing costs for mortgages, corporate debt, and other parts of the economy.
Treasury Yields Reach Two-Decade Highs
#5 - Market Leadership Narrows
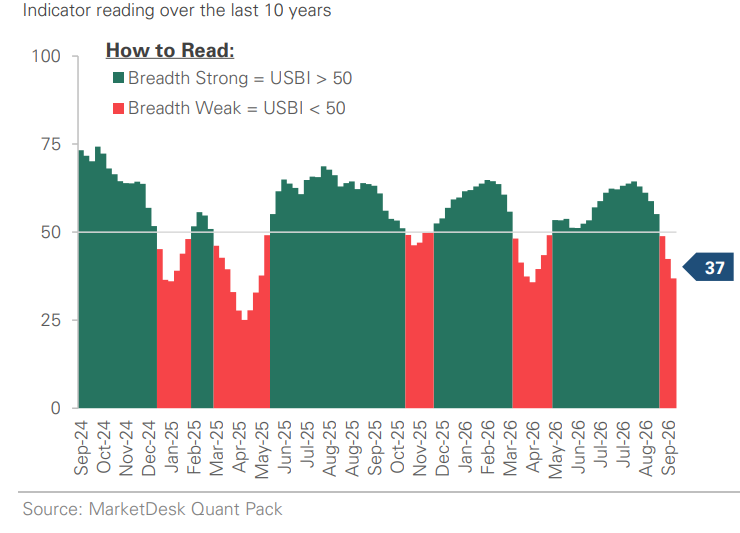
The market-cap-weighted S&P 500 has fallen about -2% from its mid-August high, but its equal-weight counterpart has fallen around -6% over the same period, showing that the typical stock has experienced a more difficult environment than the headline index suggests. Higher bond yields have created a tougher backdrop for many companies, while exceptionally strong earnings and investment tied to AI have continued to support several of the market's largest technology stocks.
Implication – Market leadership has become increasingly concentrated, reflecting both a tougher rate environment for many companies and strong fundamental growth in a small group of technology stocks.
Market Participation Weakens
Important Disclosures
This material is provided for general and educational purposes only and is not investment advice. Your investments should correspond to your financial needs, goals, and risk tolerance. Please consult an investment professional before making any investment or financial decisions or purchasing any financial, securities, or investment-related service or product, including any investment product or service described in these materials.
Our Insights