
Photo Credit: Debby Hudson
Key Updates on the Economy & Markets
The third quarter combined solid economic and corporate fundamentals with renewed pressure from oil and interest rates. Oil traded back above $100 per barrel, inflation stayed elevated, Treasury yields surged, and the Federal Reserve raised rates in September. The S&P 500 traded higher and set a new all-time high as corporate earnings and economic activity remained strong, but beneath the headline gain, market leadership narrowed as smaller companies and rate-sensitive areas lagged. Meanwhile, artificial intelligence continued to play a large role in both the economy and financial markets. In this letter, we examine the forces pushing interest rates higher, the economic and earnings strength helping offset those pressures, and AI’s growing influence on everyday borrowing costs, business investment, and the stock market.
Fed Raises Interest Rates as Oil Remains Volatile
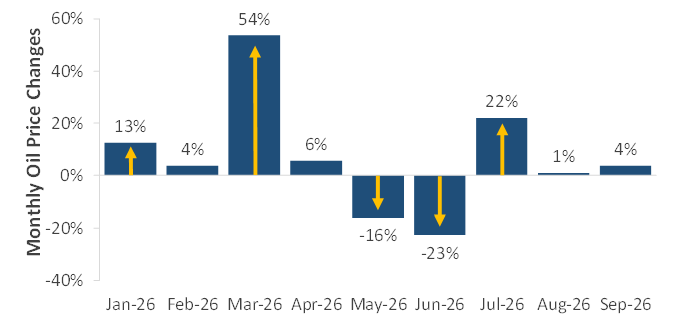
Oil remained a major driver in the third quarter, with sharp price swings affecting inflation, interest rates, and economic growth. The top chart in Figure 1 graphs the monthly change in oil prices this year, highlighting how frequently prices have changed direction. After surging early in the year, oil fell sharply in May and June before reversing higher again in Q3, with a +22% increase in July. The main takeaway isn’t any single monthly move, but how frequently the direction changed.
Most of the volatility is tied to changing expectations for Middle East oil supplies and the uncertainty around the Strait of Hormuz. Those swings in oil prices matter beyond the energy market because oil feeds into gasoline and transportation costs, inflation, and ultimately the outlook for interest rates and economic growth. When oil fell in Q2, some of those pressures eased. As prices moved higher again in Q3, concerns about inflation and the path of interest rates resurfaced. The changing backdrop significantly affected the interest rate outlook. Earlier in the year, investors were focused on how much the Fed could lower rates. However, as oil rebounded and inflation stayed above the Fed’s target, the discussion gradually shifted to whether policymakers would need to raise rates instead.
Geopolitical Headlines Keep Oil Market Volatile
Source: Energy Information Administration (EIA). Time Period: 12/31/2025 to 9/30/2026.
U.S Federal Fund Rates
Source: Federal Reserve. The Federal Funds Rate is the target interest rate set by the Federal Reserve at which commercial banks borrow and lend excess reserves overnight. Monthly data. Time Period: 12/31/2015 to 9/30/2026. Latest available data as of 9/30/2026.
Fed Resumes Rate Hikes as Inflation Shapes the Outlook
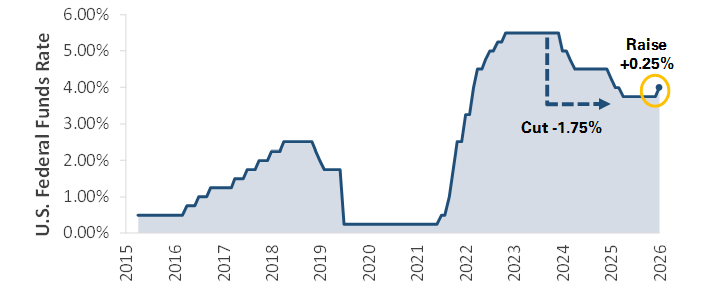
The bottom chart above shows the impact on Fed policy. After cutting rates by -1.75% since September 2024, the Fed held rates steady for most of this year. Following a 9-month pause, the central bank raised rates by +0.25% in September, the first increase since 2023. The market expects additional hikes in the coming quarters, although those expectations have changed frequently throughout the year. The broader takeaway is that the path for interest rates remains closely tied to how inflation, oil prices, and economic growth develop into year-end and early 2027.
Strong Earnings and Economic Growth Provide Fundamental Support Amid Volatility
Volatility in oil, inflation, and interest rates complicated the economic backdrop, but underlying data remained strong, providing fundamental support for the stock market. Corporate earnings remained strong and households and businesses continued to spend, providing a constructive counterpoint to the quarter’s uncertainty.
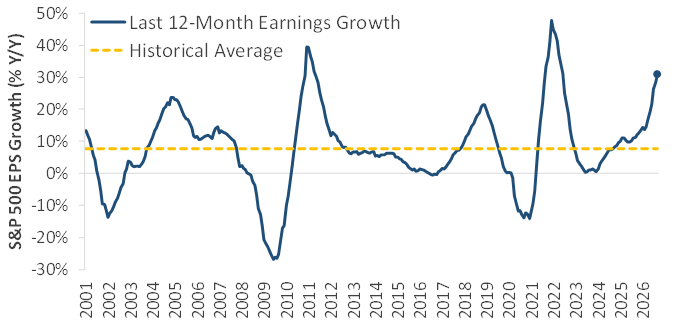
The first chart graphs S&P 500 earnings growth rate since 2001. It shows corporate earnings have remained strong, with S&P 500 12-month earnings up nearly 30% over the past year. It’s one of the strongest periods of earnings growth outside the post-financial crisis and post-COVID rebounds and a significant improvement over the single-digit pace seen in 2023 and 2024. The earnings data stood in contrast to the more volatile macro backdrop, with corporate profits continuing to grow at a strong pace.
Earnings & Economic Growth Remain Strong
Source: S&P Dow Jones Indices. The chart graphs the year-over-year growth rate of the S&P 500’s trailing 12-month earnings per share (EPS), using monthly data points. Time Period: 1/31/2001 to 9/30/2026.
Strong Earnings and Economic Growth Support Markets
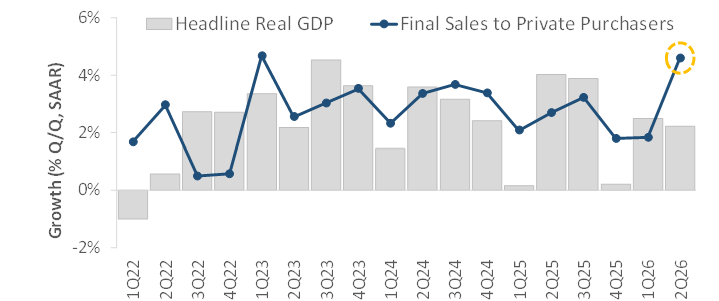
Source: U.S. Bureau of Economic Analysis (BEA). Quarter-over-quarter seasonally adjusted annualized rate (SAAR). Time Period: Q1 2022 to Q2 2026. Latest available data as of 9/30/2026.
The bottom chart below the headline GDP growth shows what households and businesses were doing. Headline GDP includes volatile categories such as trade, inventories, and government spending, while the second measure, final sales to private purchasers, focuses more on consumer spending and private investment. Comparing the two helps show whether changes in overall growth reflect the underlying economy or temporary swings. In the second quarter, headline GDP grew at an annualized rate of +2.2 %, down from +2.5% in Q1, while underlying private demand grew +4.6%. The gap suggests households and businesses continued spending and investing at a healthy pace even as the broader economic backdrop grew more volatile.
The two charts help explain why markets absorbed the quarter’s volatility. Consumers kept spending, businesses kept investing, and corporate earnings remained strong. Together, they offset higher oil prices, persistent inflation, and rising interest rates.
AI’s Influence on Economic Growth and Financial Markets Continues to Broaden
Artificial intelligence has been a major market theme for several years, but the scale of the buildout is making it more important to the broader economy and financial markets. Figure 3 shows three ways AI’s influence is expanding: investment, financing, and the stock market itself.
The first is business investment. The top chart graphs spending on data-center construction and computer equipment, which together proxy the physical infrastructure being built to support AI. Combined investment has risen from roughly $180 billion at the end of 2023 to nearly $490 billion today, making AI-related infrastructure a major source of business investment.
Rising AI Capex Drives Increased Bond Issuance
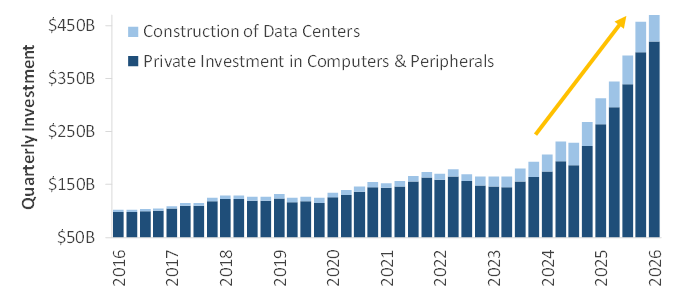
U.S. Census Bureau; U.S. Bureau of Economic Analysis (BEA). Data center construction spending and private investment in computers and peripheral equipment are shown in billions and are used as a proxy for AI-related infrastructure investment. Time Period: Q3 2016 to Q2 2026.
Strong Earnings and Private Demand Support Growth
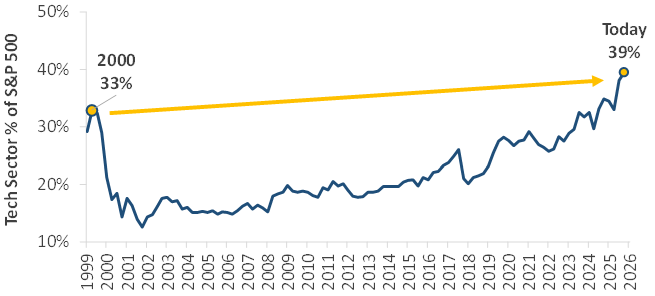
Source: S&P Dow Jones Indices. Data represents the weight of the Information Technology sector in the S&P 500. Time Period: Q4 1999 to Q3 2026.
AI Investment Expands Tech’s Footprint and Borrowing
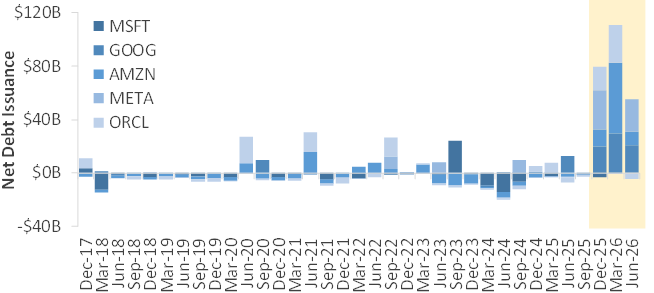
Source: Company SEC filings for Microsoft (MSFT), Alphabet (GOOG), Amazon (AMZN), Meta Platforms (META), and Oracle (ORCL). Positive values indicate a net increase in debt obligations, while negative values indicate a net reduction. References to specific companies are for illustrative purposes only and do not constitute a recommendation to buy or sell any security. Time Period: Q4 2017 to Q2 2026. Latest available data as of 9/30/2026.
The second impact is the stock market. The middle chart shows that Technology now accounts for nearly 40% of the S&P 500, up from about 34% at the end of 2025. As that share has grown, the index has become more sensitive to the performance of its largest sector. As a result, strong AI-related earnings and stock gains can have an outsized influence on the broader index.
The third impact relates to financing. Major U.S. tech companies remain highly profitable, but their AI investment programs have grown quickly. The bottom chart shows that several of these companies increasingly use the bond market to finance the buildout. Historically, the group balanced debt issuance and reductions, but the right side of the chart shows a significant jump in new debt issuance. The main takeaway is that AI’s influence is no longer limited to business investment and the stock market; the scale of the buildout is also driving a surge in bond issuance and reshaping the broader capital markets.
The three charts show how AI has moved beyond a narrow technology theme. The buildout is supporting business investment, drawing on the bond market for financing, and carrying increasing weight in the stock market. Its growing scale means AI now influences multiple parts of the economy and financial markets.
Equity Market Recap – Market Leadership Narrows Late in Q3 as Interest Rates Rise
The S&P 500 finished Q3 higher and set a new all-time high, but the quarter featured an uneven return path and growing divergence beneath the index. Stocks faced early-quarter pressure before rebounding in August, when the Russell 2000, Dow Jones, and equal-weight S&P 500 each set new highs. From there, leadership narrowed as larger companies outperformed smaller ones into quarter-end.
The S&P 500 finished the quarter up 2.3%, compared with +0.6% for the Nasdaq 100, -1.5% for the Dow Jones, and -6.9% for the Russell 2000. Most of the performance gap developed during the second half of the quarter, which overlapped with a sharp rise in Treasury yields. The timing suggests rising interest rates drove return divergence across markets, as smaller companies tend to be more sensitive to borrowing costs.
Sector performance reflected the quarter’s main themes. Four of the eleven S&P 500 sectors outperformed the broad index, signaling narrow breadth. Energy led the pack, gaining +17.2% as oil climbed from around $70 per barrel in early July to more than $100 by mid-September. Energy’s outperformance reversed in Q2, when it was the bottom-performing sector as oil prices fell. Technology was the second-best-performing sector, gaining +7.2%, followed by Health Care at +6.5% and Communication Services at +3.6%. In contrast, Utilities fell -12.4% as interest rates rose, while Industrials fell -9.7% and Real Estate declined -5.6%.
International markets were relatively quiet after their first-half gains. Developed and emerging market stocks each finished the quarter within 1% of where they started, with developed modestly outperforming emerging. Both international regions are up year-to-date despite ending the quarter flat and are still outperforming the S&P 500 over the past 12 months.
The quarter ultimately produced a mixed picture beneath the major indexes. The S&P 500 finished higher and reached a new all-time high, while smaller companies and several rate-sensitive areas traded lower as Treasury yields rose later in the quarter. The divergence narrowed market leadership compared with August, with major U.S. equity indexes still higher year-to-date.
Credit Market Recap – Rising Interest Rates Weigh on Bond Prices and Fixed Income Portfolios
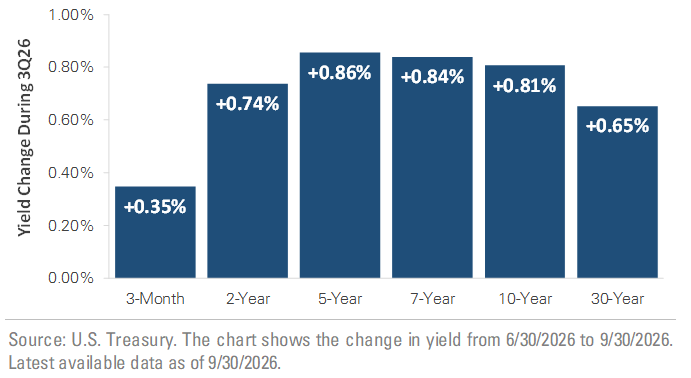
The third quarter was challenging for bonds as Treasury yields surged higher. Figure 4 graphs yield changes across maturities during Q3. It shows yields rose at every maturity, with the 5-year, 7-year, and 10-year Treasury yields each up more than +0.80% and the 30-year yield up nearly +0.70%. Longer-maturity bonds underperformed because they are more sensitive to interest rate changes, while shorter-maturity Treasuries held up better on a relative basis despite trading lower.
Treasury Yields Rose Across the Yield Curve in Q3
Rising Treasury yields also pressured corporate bonds, though they outperformed government bonds. High-yield posted a total return of -1.8% and outperformed investment-grade’s -3.7%, which was more sensitive to rising rates because of its longer maturity. For most of the quarter, rising interest rates, not weakening credit conditions, were the primary headwind. Investment-grade and broad high-yield spreads remained relatively stable and tight by historical standards, suggesting investors stayed comfortable with corporate fundamentals even as borrowing costs rose.
The clearest sign of caution appeared at the lowest-quality end of the high-yield bond market. Spreads on CCC-rated bonds, which are the lowest-rated high-yield bonds, widened even as spreads on higher-quality high-yield bonds held steady. The trend suggests investors began demanding more compensation to hold debt from financially weaker borrowers. While broader high-yield spreads were relatively calm for most of Q3, they began to widen in late September. The move suggests the market became more selective as the quarter progressed, with higher financing costs hitting the most sensitive borrowers first.
Rising Treasury yields, not a broad deterioration in corporate credit, drove Q3's bond-market weakness. High-yield spreads widened late in the quarter, particularly among the lowest-quality borrowers, but investment-grade and broader high-yield spreads remained relatively contained. This distinction suggests higher financing costs were pressuring pockets of the market rather than the full credit market.
2026 Outlook – What to Watch in Q4
Economic growth and corporate earnings remain strong heading into Q4, even as higher oil prices and interest rates have created a mixed and volatile backdrop. One of the main questions heading into Q4 is whether the underlying strength continues as households and businesses adjust to higher borrowing costs, persistent inflation pressure, and continued uncertainty around energy prices.
The economy has handled those pressures relatively well thus far. Consumers have kept spending, businesses have kept investing, and unemployment has remained low. Those trends have helped support economic growth even as interest rates and borrowing costs have risen. The coming months will provide a clearer read on whether momentum continues, particularly through economic data on consumer spending, hiring, and business investment.
Corporate earnings will be another important source of information. Profit growth has been strong over the past year and provided fundamental support to the market amidst a volatile macro backdrop. Q3 earnings season, which begins in October, will offer an updated view of how companies are managing higher interest rates, changing input costs, and continued investment while maintaining revenue and profit growth.
The AI investment cycle will remain an important part of the discussion. Spending on data centers, computing equipment, and related infrastructure continues to support business investment, while large technology companies increasingly use the bond market to finance the buildout. As the cycle matures, the focus will likely broaden from how much is being spent to what that investment produces in revenue, profits, and productivity.
Markets have absorbed several changes this year without losing their underlying support from economic growth and corporate earnings. We will continue watching how these trends develop while keeping the focus on portfolio diversification, discipline, and meeting your long-term financial goals across a range of possible outcomes.
A Quarter of Sharply Diverging Returns

Important Disclosures
This material is provided for general and educational purposes only and is not investment advice. Your investments should correspond to your financial needs, goals, and risk tolerance. Please consult an investment professional before making any investment or financial decisions or purchasing any financial, securities, or investment-related service or product, including any investment product or service described in these materials.
Our Insights