

Photo Credit: Alex Krivec
Weekly Market Recap for September 25th
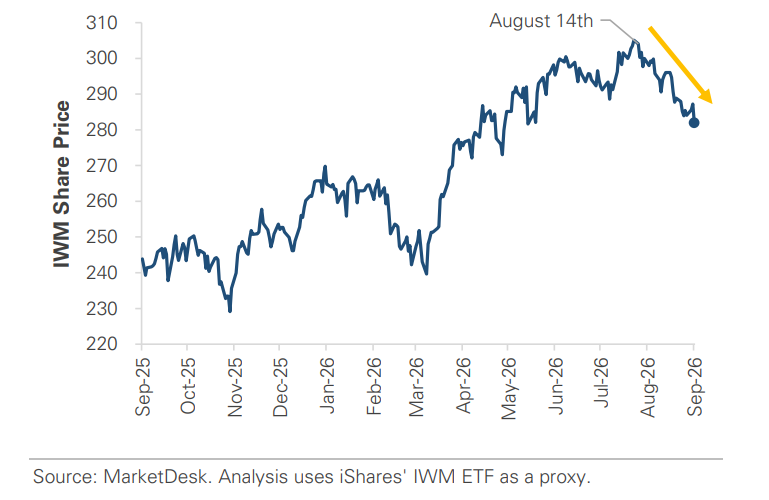
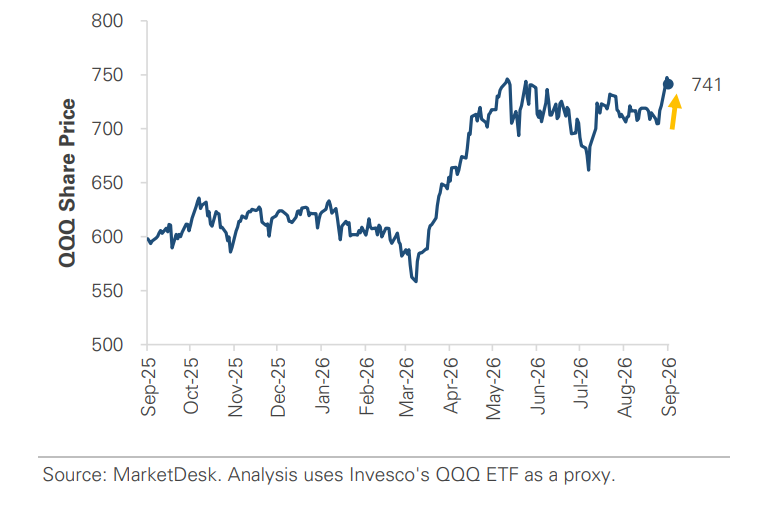
Markets were mixed this week as gains in large-cap technology stocks offset broader market weakness, while long-term Treasury yields moved sharply higher. The S&P 500 gained +0.9% and the Nasdaq rose +3.5%, while the Russell 2000 small-cap index fell -1.3%. Growth (+2.5%) outperformed Value (-0.7%), and the Equal-Weight S&P 500 declined -1.0%, signaling narrow leadership. Technology led all sectors with a +3.6% return, while Utilities (-4.4%), Energy (-2.3%), Financials (-2.1%), and Real Estate (-1.8%) lagged the market. Bonds declined as Treasury yields rose across the yield curve, with long-maturity Treasuries falling -2.8% and investment-grade bonds declining -1.9%. The U.S. dollar strengthened +1.0% as rates rose, oil declined -2.0% despite intra-week volatility, and Bitcoin gained +10%.
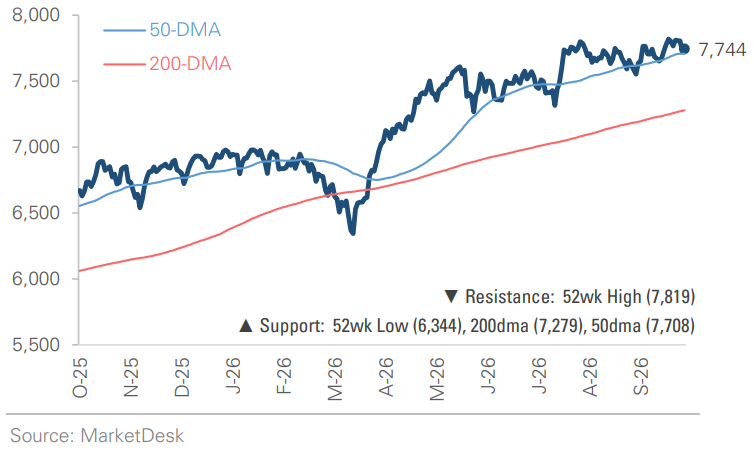
S&P 500 Index (Last 12 Months)
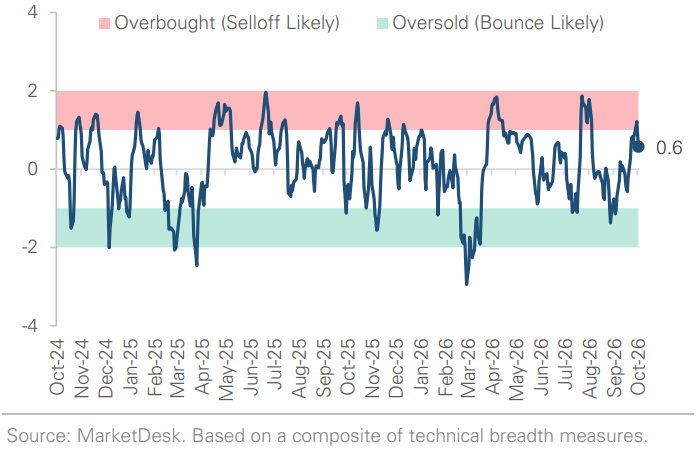
S&P 500 Technical Composite (Last 24 Months)
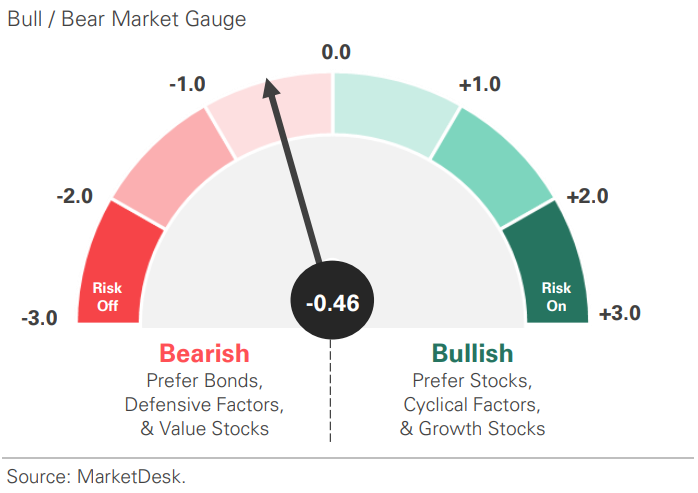
US Risk Demand Market Indicator
The US Risk Demand Indicator (USRDI) is a quantitative tool to measure real-time investor risk appetite. When the indicator is above zero, it signals a risk-on environment favoring cyclical sectors, high-beta stocks, high-yield corporate bonds, and hybrid (convertible) bonds. In contrast, a reading below zero signals a risk-off environment favoring defensive sectors, low-volatility stocks, and US Treasury bonds.
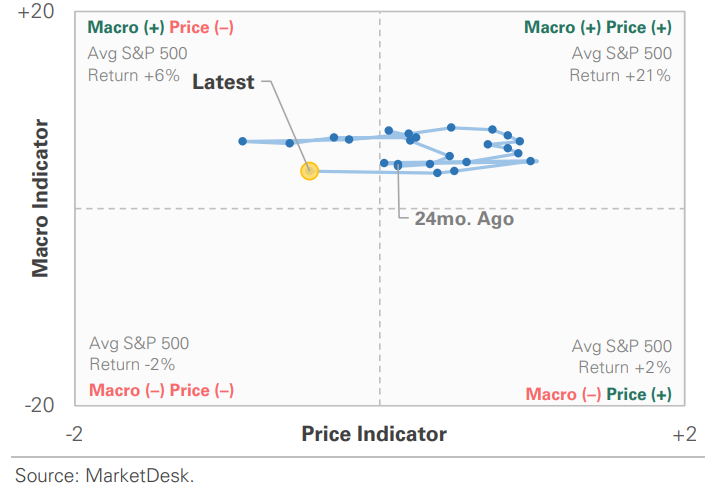
US Market Economic Cycle Indicator
The Market Cycle Indicator tracks two primary investor groups: macro investors and price-based investors. Macro investors rely on fundamental and economic data to guide their decisions, while price-based investors (or technical analysts) focus on price action, momentum, volume, and behavioral trends. The Indicator synthesizes these perspectives to identify the prevailing market regime.
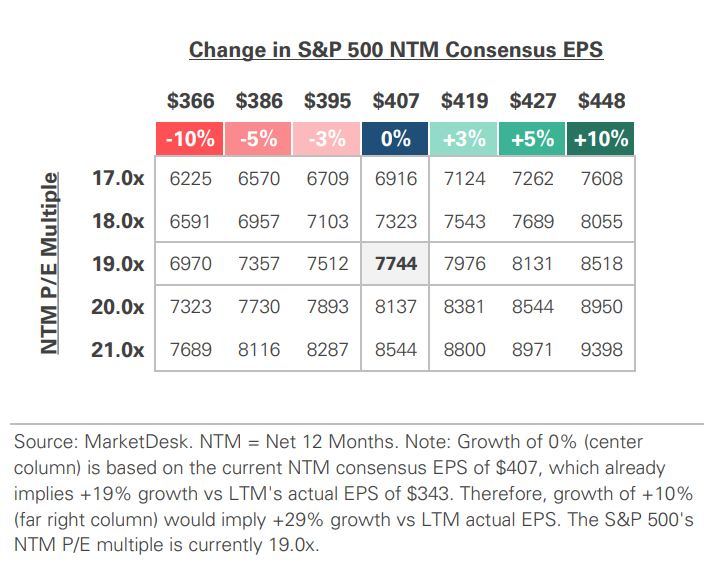
S&P 500 Valuation Matrix
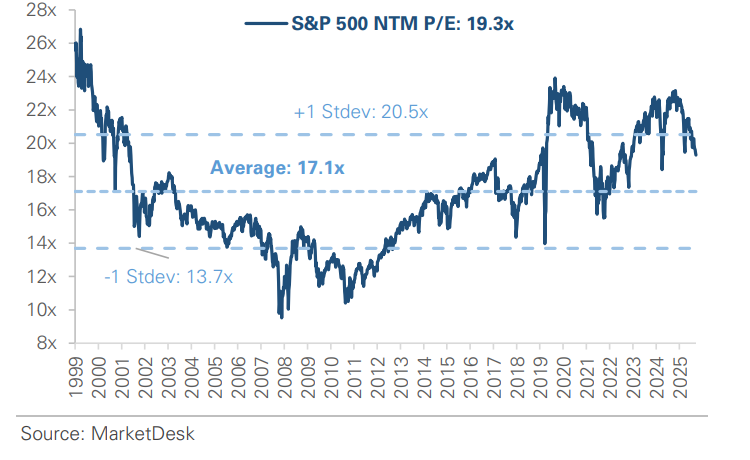
S&P 500 Forward PE Ratio
The S&P 500 forward price-to-earnings (P/E) ratio is a widely followed valuation metric that compares the index's current level to the projected earnings of its constituent companies over the next 12 months. The indicator implies to investors how much they are paying today for each dollar of expected future earnings.
Key Takeaways
#1 - Treasury Yields Climb
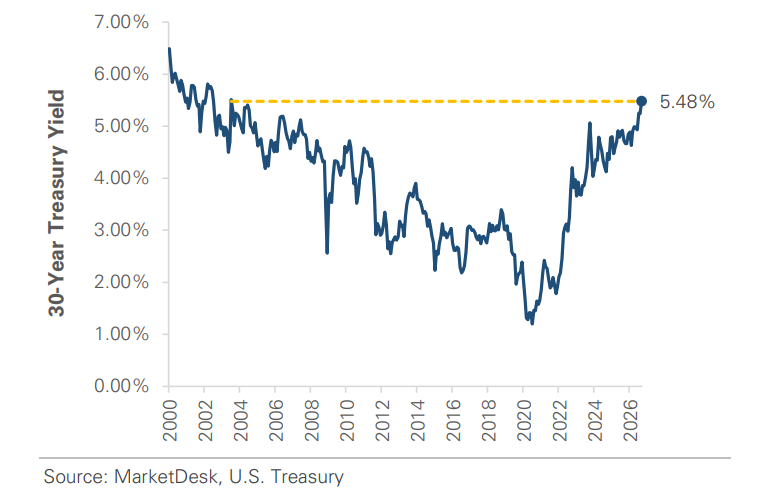
The 10-year Treasury yield approached 5.15%, its highest level since 2007, while the 30-year climbed above 5.40%, its highest level since 2004. Multiple factors contributed to the continued rise in yields, including stronger economic data, persistent inflation pressure, higher oil prices, and heavy new Treasury issuance.
Implication – The move is notable not just because yields are high, but because they have risen rapidly. The faster rates move, the faster markets must adjust expectations for economic growth, inflation, and borrowing costs, which can increase volatility.
30-Year Treasury Yield Now the Highest Since 2004
#2 - Business Activity Strengthens
Consumer spending increased more than expected in September. Retail sales rose 0.8% month-over-month, exceeding expectations of 0.3%, and analysts also revised up August's increase to 1.3%. However, September’s strength partly reflected higher gasoline prices. Because retail sales aren’t adjusted for inflation, higher fuel prices can boost reported spending. This was especially evident in September, when gasoline station sales rose +6.4%. Excluding gas stations, retail sales rose +0.2%. Separately, spending at restaurants and other retailers remained positive, suggesting consumers kept buying despite higher costs.
Implication: The report points to continued consumer spending, although growth outside gasoline stations was more modest than the headline suggested.
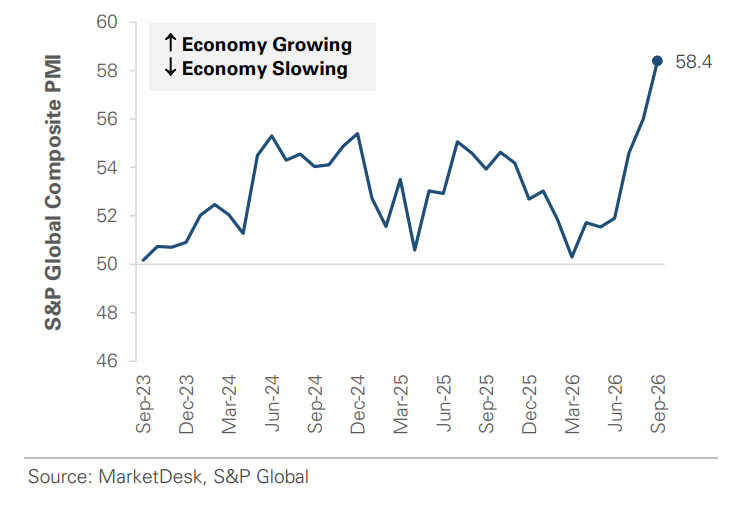
S&P Global Composite PMI
#3 - Meta’s Muse Divides Markets
The preliminary S&P Global U.S. Composite Purchasing Managers’ Index rose to 58.4 from 56.0 in August, well above expectations and its strongest reading since 2021. Businesses also reported the fastest hiring in more than four years, while input costs increased at their fastest pace in four years. The index is based on a business survey rather than hard economic data, but it provides an early indication of changing activity.
Implication – The survey suggests economic activity remains solid. The combination of strong activity and persistent price pressures is pushing Treasury yields higher and reinforcing expectations that the Fed may need to keep rates elevated or tighten further.
Small Cap Stocks Continue to Trade Lower
Nasdaq 100 Sets a New All-Time High
#4 - Consumer Confidence Weakens
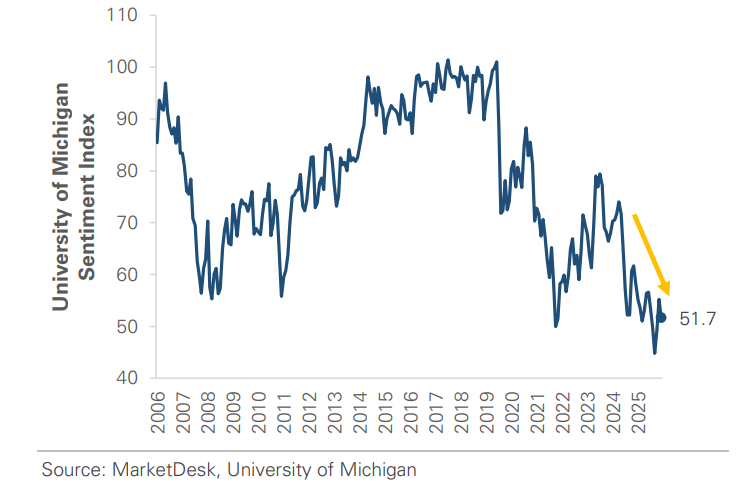
The preliminary University of Michigan Consumer Sentiment Index fell to 47.8 from 51.7, with consumers becoming notably less optimistic about their personal finances and the future business environment. One-year inflation expectations also rose to 4.6% as higher fuel prices and trade-related concerns added to worries about household costs. This weaker sentiment contrasts with recent data showing consumers continue to spend despite a more cautious outlook.
Implication – Consumers remain active, but they are increasingly concerned about inflation, borrowing costs, and the outlook for their finances and the broader economy.
Consumer Sentiment Remains Weak
Important Disclosures
This material is provided for general and educational purposes only and is not investment advice. Your investments should correspond to your financial needs, goals, and risk tolerance. Please consult an investment professional before making any investment or financial decisions or purchasing any financial, securities, or investment-related service or product, including any investment product or service described in these materials.
Our Insights