Tax Cut Bill Passes, Jobs and PMI Reports, and Q2 Earnings Expectations

Photo Credit: Bernard Hermant, Unsplash
Weekly Market Recap for July 11th
This week, there was an underlying rotation in the market. The Russell 2000 and S&P 500 equal-weight outperformed the S&P 500, while the momentum factor traded lower. High Beta continued to outperform, benefiting from its semiconductor OW, while Low Volatility traded lower, signaling a preference for risk assets. Cyclical sectors such as energy, industrials, and materials outperformed, while consumer staples and financials traded lower. Treasury yields finished unchanged primarily after rising earlier, with short- and long-term bonds producing similar returns. In the corporate market, IG and HY underperformed as credit spreads widened. Oil posted a modest loss, and the dollar snapped its losing streak to finish stronger. Implied volatility eased, with the VIX and MOVE indices signaling a calmer market.
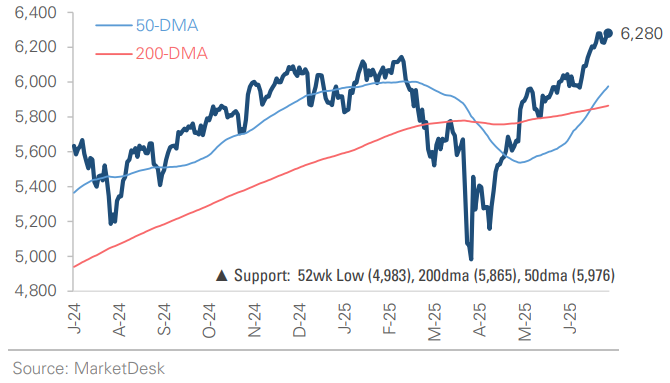
S&P 500 Index (Last 12 Months)
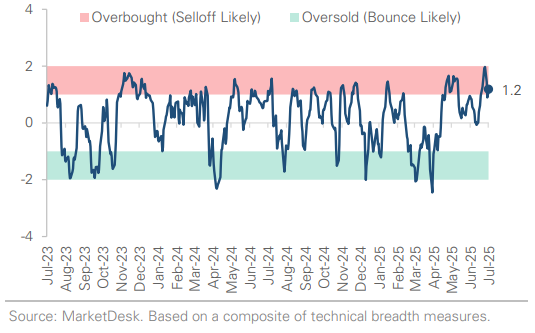
S&P 500 Technical Composite (Last 24 Months)
US Risk Demand Market Indicator
The US Risk Demand Indicator (USRDI) is a quantitative tool to measure real-time investor risk appetite. When the indicator is above zero, it signals a risk-on environment favoring cyclical sectors, high beta stocks, high-yield corporate bonds, and hybrid (convertible) bonds. In contrast, a reading below zero signals a risk-off environment favoring defensive sectors, low-volatility stocks, and US Treasury bonds.

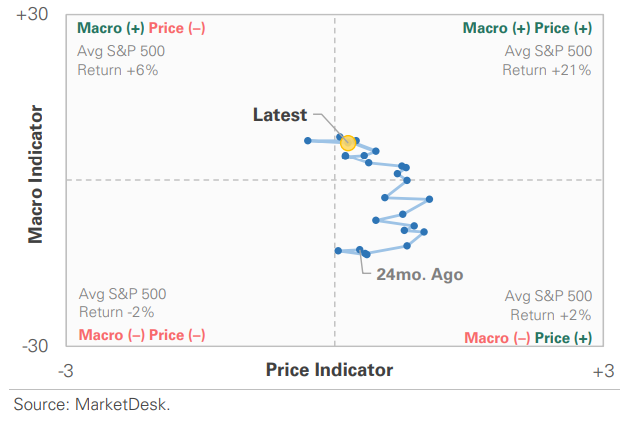
US Market Economic Cycle Indicator
The Market Cycle Indicator tracks two primary investor groups: macro investors and price-based investors. Macro investors rely on fundamental and economic data to guide their decisions, while price-based investors (or technical analysts) focus on price action, momentum, volume, and behavioral trends. The Indicator synthesizes these perspectives to identify the prevailing market regime.
S&P 500 Valuation Matrix

Key Takeaways
#1 - US Added 147,000 Jobs in June
The US added 147,000 jobs in June, beating the 110,000 consensus. State & local government (+77k) and health care/social assistance (+58k) accounted for over half the gains, while manufacturing, professional services, and the federal government cut payrolls. Private-sector hiring slowed to 74,000, the lowest since October 2024. Unemployment fell to 4.1%, holding steady in its narrow 4.0% to 4.2% range since May 2024. One factor keeping conditions tight is the participation rate for those aged 55+, which fell to a new post-pandemic low. This, along with stricter immigration enforcement, weighs on the labor supply.
Implication: The headline beat and falling unemployment reduce the likelihood of a July rate cut.
Private-Sector Hiring Slows

55+ Labor Force Participation Rate Falls To 2006 Levels

#2 - ISM Manufacturing PMI Index
The ISM Manufacturing PMI edged up to 49 in June but remained in contraction for a fourth straight month. Production rebounded above 50, but new orders (46.4) and employment (45.0) weakened while prices paid stayed high (69.7). The Services PMI returned to expansion, with business activity (54.2) and new orders (51.3) back above 50. However, like manufacturing, employment fell to 47.2, and prices paid remained elevated at 67.5.
Implication: Manufacturing and services activity improved in June, but the data suggests tariffs are weighing on factory activity, reducing labor demand, and creating price pressures.
#3 - Congress Passes The “Big Beautiful Bill”
Congress passed the administration's "Big Beautiful Bill" last week, the most sweeping fiscal package since 2017. The bill makes the 2017 cuts permanent, raises the SALT cap, and introduces new tax breaks for tips, overtime, and seniors. It also increases defense and border spending while rolling back clean energy incentives. Non-partisan analysts estimate the bill will add $3.3 to $3.4 trillion to the national debt over the next decade, setting the stage for increased Treasury issuance.
Implication: BBB is a near-term boost to growth (a front-loaded "sugar rush"), but in the long term, it could weigh on the economy through higher deficits and persistent inflation.
#4 - Bill Raises Debt Ceiling
The bill raises the debt ceiling by $5 trillion, enabling the Treasury to borrow again. Our U.S. Net Liquidity Indicator shows the debt ceiling’s pause on borrowing boosted market liquidity this year (i.e., Treasury spent money but did not raise new money). It needs to borrow ~$450 billion in the next few months to rebuild its cash balance. Secretary Bessent plans to issue mostly Treasury bills, which should limit the near-term liquidity impact due to the $7 trillion in money market funds. In the long term, the market must absorb the increased treasury issuance, potentially draining liquidity from bank reserves and the stock market.
Implication: Raising new debt pulls liquidity from the financial system, can reduce demand for risk assets like stocks, and push yields higher, creating a headwind for equity markets.
#5 - Q2 Earnings Season
Q2 earnings season starts next week. Analysts cut estimates in Q2, with the S&P 500's EPS estimate falling over -4% since March 31. Earnings are forecast to grow +5% y/y, down from Q1’s +13.3% and the slowest since Q4 2023. Key themes to watch include how companies respond to tariffs, the impact of a weak USD, and whether AI companies will continue to power earnings growth at the index level.
Implication: Our S&P 500 Earnings Indicator declined in Q2 and is now below consensus. The bar has been lowered, and investors will be focused on whether companies can clear it.
Earnings Estimates Lowered During Q2

Important Disclosures
This material is provided for general and educational purposes only and is not investment advice. Your investments should correspond to your financial needs, goals, and risk tolerance. Please consult an investment professional before making any investment or financial decisions or purchasing any financial, securities, or investment-related service or product, including any investment product or service described in these materials.
Our Insights