Fed Policy, AI Sector Divergence, Q3 Earnings, and Delayed Economic Data

Photo Credit: Libby Penner, Unsplash
Weekly Market Recap for November 28th
This week, the equity market staged a broad rebound, recovering a portion of this month’s losses. The surge followed last Friday’s Fed commentary, which reopened the door to a December rate cut. Major equity indices rallied sharply, with gains spread across sectors and factors. Small-cap stocks were the standout performers, signaling a rotation into interest-rate-sensitive stocks that stand to benefit most from a December rate cut. The VIX market volatility index fell to a 1-month low after its recent spike, reflecting renewed confidence in the Fed’s pivot. The shift in the policy outlook drove Treasury yields lower across the yield curve, with the short end seeing the steepest decline. Falling yields pushed bond prices higher, with longer-maturity Treasury and corporate bonds outperforming. Gold traded higher, while oil continued to trade lower.
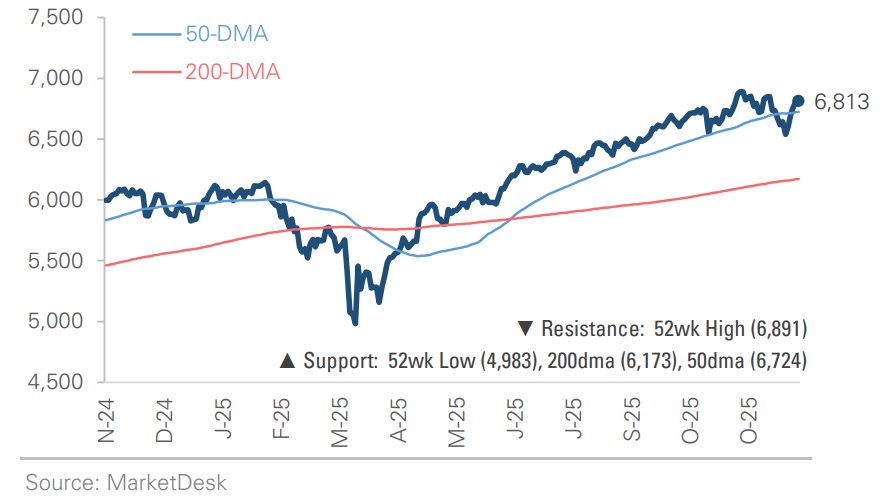
S&P 500 Index (Last 12 Months)
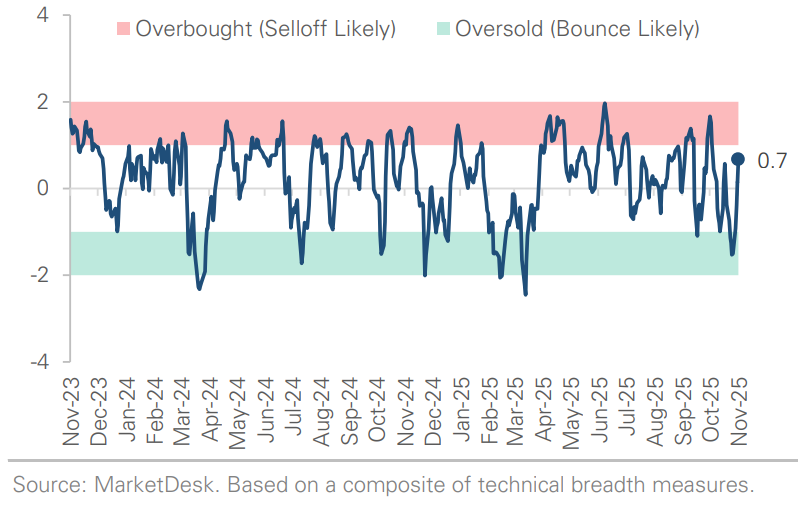
S&P 500 Technical Composite (Last 24 Months)
US Risk Demand Market Indicator
The US Risk Demand Indicator (USRDI) is a quantitative tool to measure real-time investor risk appetite. When the indicator is above zero, it signals a risk-on environment favoring cyclical sectors, high beta stocks, high-yield corporate bonds, and hybrid (convertible) bonds. In contrast, a reading below zero signals a risk-off environment favoring defensive sectors, low-volatility stocks, and US Treasury bonds.

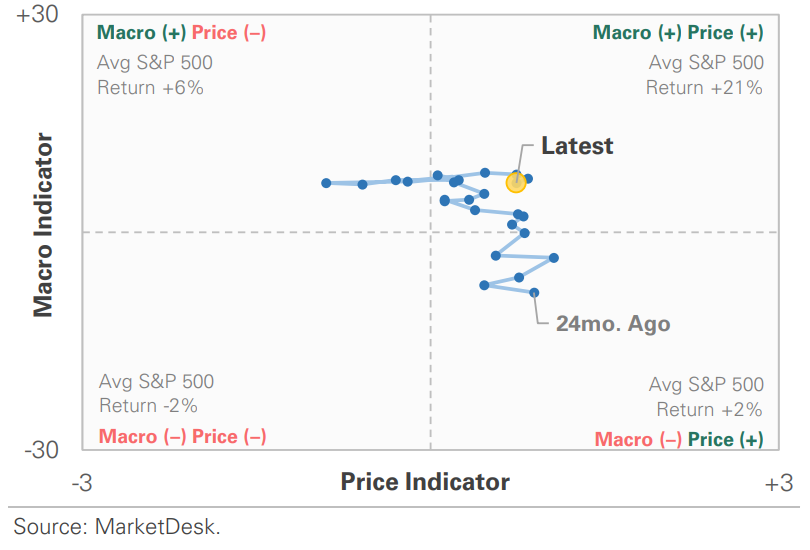
US Market Economic Cycle Indicator
The Market Cycle Indicator tracks two primary investor groups: macro investors and price-based investors. Macro investors rely on fundamental and economic data to guide their decisions, while price-based investors (or technical analysts) focus on price action, momentum, volume, and behavioral trends. The Indicator synthesizes these perspectives to identify the prevailing market regime.
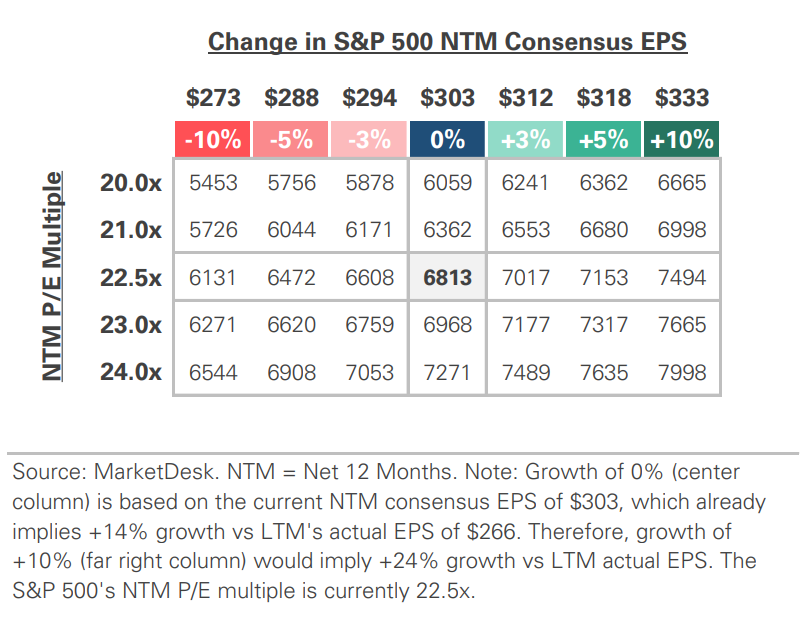
S&P 500 Valuation Matrix
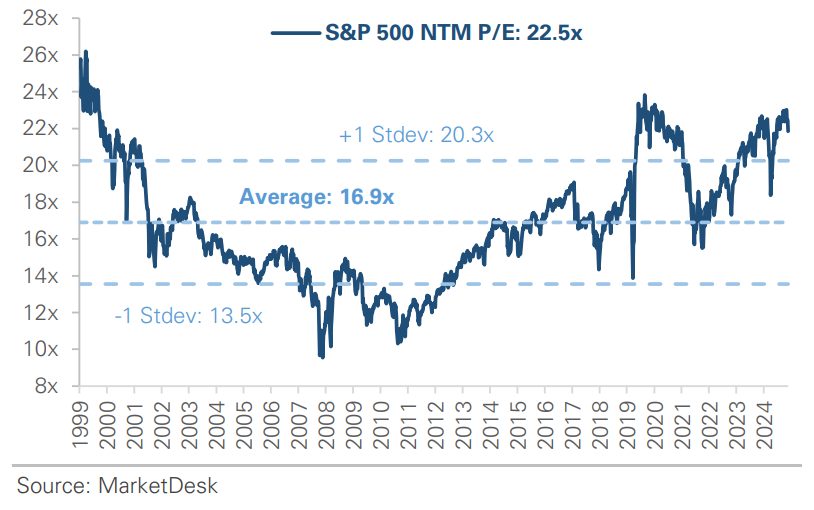
S&P 500 Forward PE Ratio
The S&P 500 forward price-to-earnings (P/E) ratio is a widely followed valuation metric that compares the index's current level to the projected earnings of its constituent companies over the next 12 months. The indicator implies to investors how much they are paying today for each dollar of expected future earnings.
Key Takeaways
#1 - A Federal Reserve Rate Cut in December?
The probability of a Federal Reserve rate cut in December surged above 80% this week, reversing last week’s plunge below 40%. The shift followed September labor data showing a rise in the unemployment rate, prompting Fed officials to express renewed concern about labor market conditions. Meanwhile, continuing jobless claims rose to nearly 2 million the first week of November, the highest level in four years. The combination suggests that while layoffs remain low, it is becoming more difficult for displaced workers to find new jobs. Despite the market’s conviction, the path forward is complicated and uncertain. The Fed does not have the latest data due to the government shutdown, and the October meeting minutes revealed significant internal dissent about the path forward.
Implication: The market expects four rate cuts by the end of 2026, starting next month, but Fed policy is far from settled.
Stocks Rebound on December Rate Cut Expectations

Continuing Jobless Claims Rise to a 4-Year High

#2 - A Sharp Reversal in Equity Markets
The reversal in rate-cut odds contributed to the sharp decline in equity markets this week. The S&P 500 traded lower throughout the first three weeks of November, driven by the falling probability of a December rate cut and AI concerns. However, commentary from Fed officials pointing to a December cut reignited investor risk appetite, sparking a strong multi-day rally.
Implication: The December Fed meeting has become the market’s next major catalyst, with sentiment swinging in response to changing rate-cut expectations.
#3 - AI Trade
Investors are scrutinizing the AI sector more closely, leading to a sharp divergence in performance. The key distinction is how companies finance their capital expenditures, particularly those that rely on large, debt-funded infrastructure spending plans. Oracle serves as an example, with its stock down more than -40% from its September peak after raising $18 billion in debt to support its AI expansion.
Implication: While demand for AI infrastructure remains strong, investors are now focused on whether these massive capital outlays will deliver tangible returns. Companies funding large-scale projects with aggressive debt are facing increased pressure to justify their spending.
Oracle Falls as Investors Scrutinize AI Trade

#4 - Q3 Earnings Shows Strong Results
The Q3 earnings season is nearing an end, with companies reporting strong results. S&P 500 earnings growth is tracking over +13% year-over-year, nearly double the consensus forecast of +7-8%. Additionally, 83% of companies reported a positive EPS surprise, well above the 10-year average. The index’s aggregate net profit margin is nearing a record 13.1%, underscoring companies’ strong pricing power and cost management.
Implication: Despite economic uncertainty, corporate fundamentals remain solid. The strong Q3 earnings season has boosted market sentiment and helped justify the stock market’s elevated valuation.
Over 80% of S&P 500 Index Beat Q3 EPS Estimates

#5 - A Backlog of Economic Data
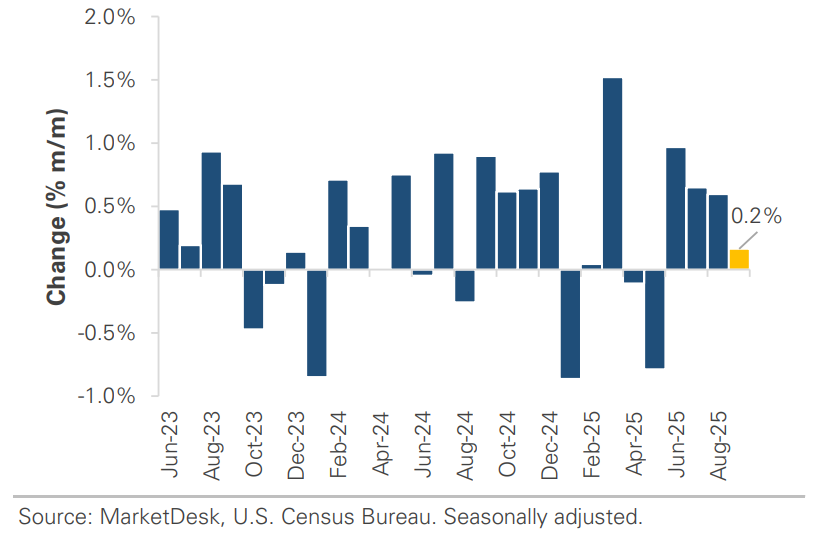
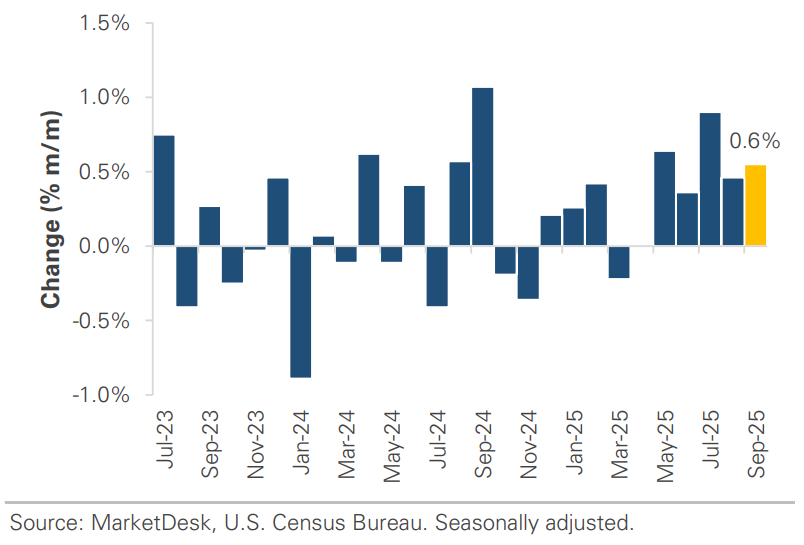
With the government shutdown over, the backlog of economic data is slowly being cleared. The initial releases show consumer spending slowed in September, while an unexpected rise in producer prices highlighted continued inflation pressures. Durable goods orders were stronger than expected, signaling healthy business investment, and pending home sales rose, suggesting the Fed’s recent rate cuts are spurring activity and demand in the housing market.
Implication: The data provides insight into the economy, but it comes with a significant delay. It will take time to get a timely and accurate picture of current conditions.
Retail Sales Growth Slowed in September
Durable Goods Orders Signal Solid Business Demand
Important Disclosures
This material is provided for general and educational purposes only and is not investment advice. Your investments should correspond to your financial needs, goals, and risk tolerance. Please consult an investment professional before making any investment or financial decisions or purchasing any financial, securities, or investment-related service or product, including any investment product or service described in these materials.
Our Insights