AI Selloff, December Rate Cut, Delayed Jobs Report, and Nvidia Earnings

Photo Credit: Getty Images, Unsplash
Weekly Market Recap for November 21st
This week, markets were volatile amid AI valuation concerns and Fed policy uncertainty, which pressured equities. Stocks traded lower for four straight sessions, led by weakness in technology and AI-related companies. Bitcoin continued its slide from October's peak, and market volatility spiked. The market staged a late-week rebound sparked by stronger-than-expected labor market data and Nvidia's strong Q3 earnings, but the bounce was short-lived. Defensive segments outperformed for the week, including the Low Volatility factor and Consumer Staples, Utilities, and Health Care. In the credit market, Treasury yields ended the week modestly lower, with bonds flat. This week’s volatility highlights the market’s increased sensitivity to Fed policy and AI headlines, driven by the outsized influence of AI stocks in major equity indices.
S&P 500 Index (Last 12 Months)

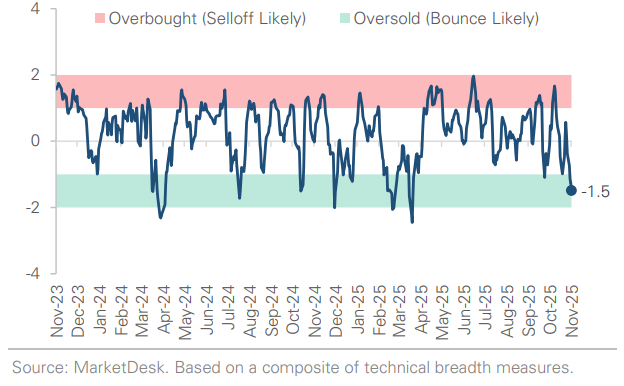
S&P 500 Technical Composite (Last 24 Months)
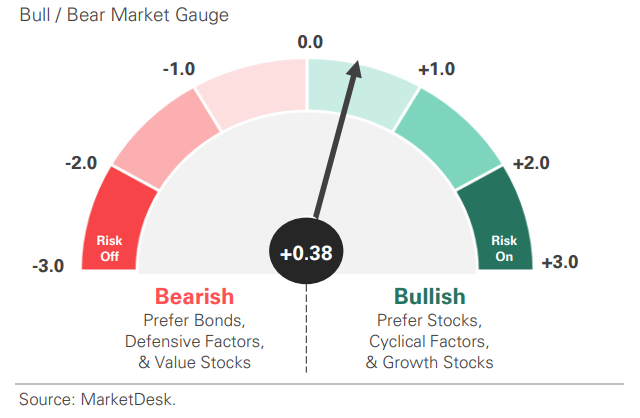
US Risk Demand Market Indicator
The US Risk Demand Indicator (USRDI) is a quantitative tool to measure real-time investor risk appetite. When the indicator is above zero, it signals a risk-on environment favoring cyclical sectors, high beta stocks, high-yield corporate bonds, and hybrid (convertible) bonds. In contrast, a reading below zero signals a risk-off environment favoring defensive sectors, low-volatility stocks, and US Treasury bonds.
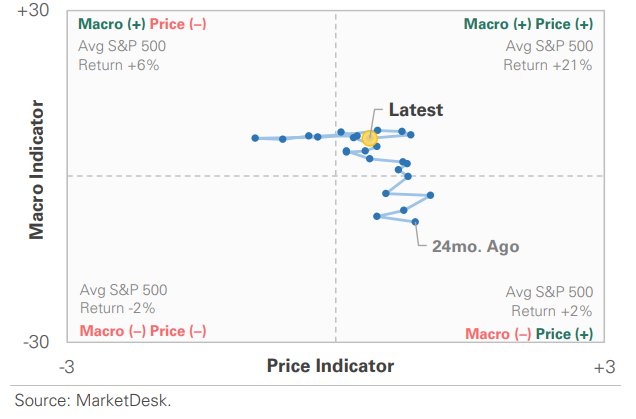
US Market Economic Cycle Indicator
The Market Cycle Indicator tracks two primary investor groups: macro investors and price-based investors. Macro investors rely on fundamental and economic data to guide their decisions, while price-based investors (or technical analysts) focus on price action, momentum, volume, and behavioral trends. The Indicator synthesizes these perspectives to identify the prevailing market regime.
S&P 500 Valuation Matrix

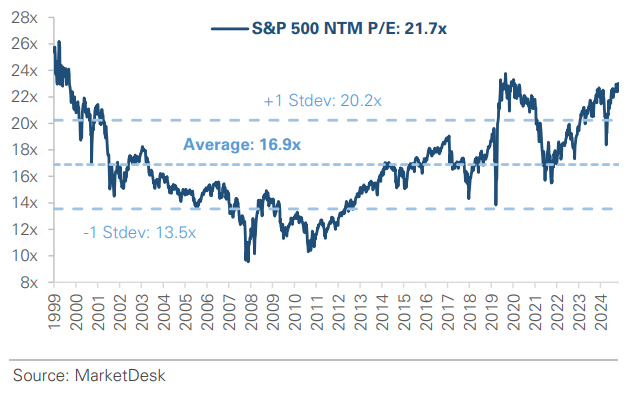
S&P 500 Forward PE Ratio
The S&P 500 forward price-to-earnings (P/E) ratio is a widely followed valuation metric that compares the index's current level to the projected earnings of its constituent companies over the next 12 months. The indicator implies to investors how much they are paying today for each dollar of expected future earnings.
Key Takeaways
#1 - AI Stocks And The Broader Market Sell Off
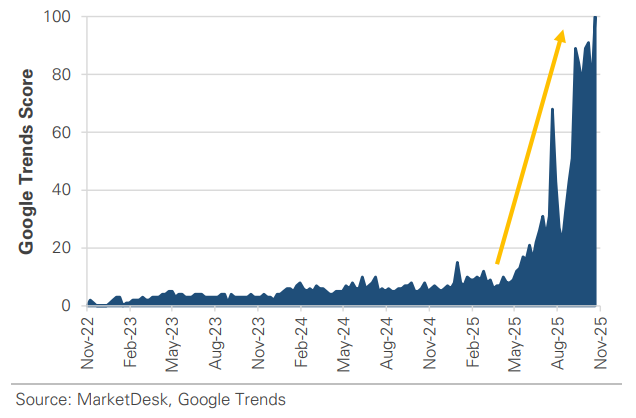
AI stocks and the broader market have faced a sharp but contained sell off in November, unwinding part of a six-month rally. Semiconductors and mega-cap tech stocks led the pullback, driven by fears of an AI bubble, stretched valuations, crowded positioning, and questions about how quickly AI spending will translate into earnings growth.
Implication: While investors see AI as a transformative technology, the gap between the large upfront investment and uncertain future revenue is fueling market volatility and pressuring valuations.
Google Search Trends Score “AI Bubble”
#2 - Risk Appetite Reduction
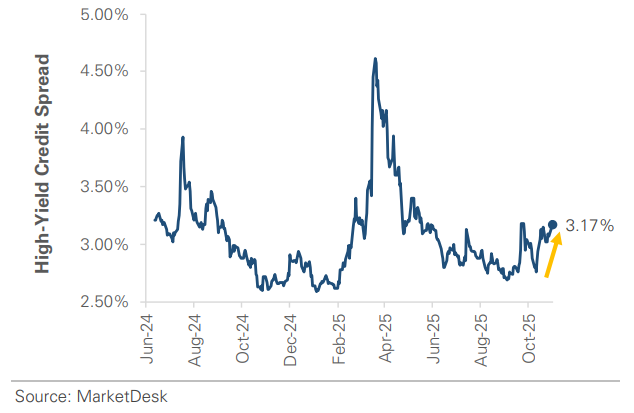
The selloff is part of a broader pullback in risk appetite across financial markets. High-yield corporate credit spreads have widened, signaling rising concern over economic growth and default risk. Equity market volatility, as measured by the VIX index, has surged, reflecting increased uncertainty. Crypto markets have echoed the broader risk-off shift, with Bitcoin plunging over -25% from October’s highs and erasing its year-to-date gains.
Implication: The selloff in AI stocks rippled through financial markets, shaking investor confidence and dampening risk appetite.
Credit Spreads Widen as Risk Demand Weakens
#3 - Potential December Fed Rate Cut
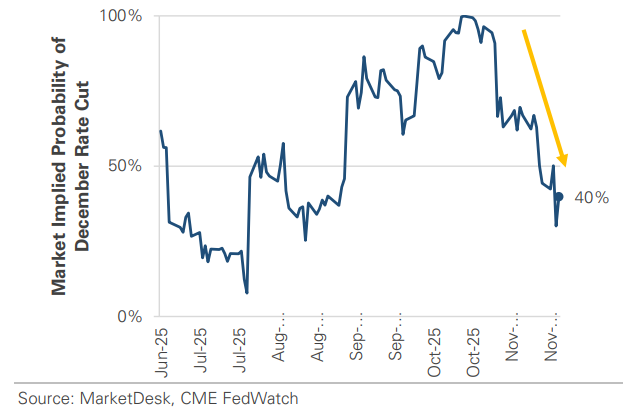
Another factor behind the selloff: growing uncertainty around a December rate cut. The pressure has been building since the Fed’s mid-October meeting, when Chair Powell said a December cut was not a foregone conclusion. The minutes from that meeting were released this week, with some officials favoring a preemptive rate cut to manage downside risks and others urging patience until there is more clarity around inflation. Market pricing now reflects that uncertainty, with odds of a December cut falling below 40%.
Implication: Markets had fully priced in a December cut a month ago. The sharp drop in expectations has become a drag on sentiment.
Probability of a December Rate Cut Falls Below 50%
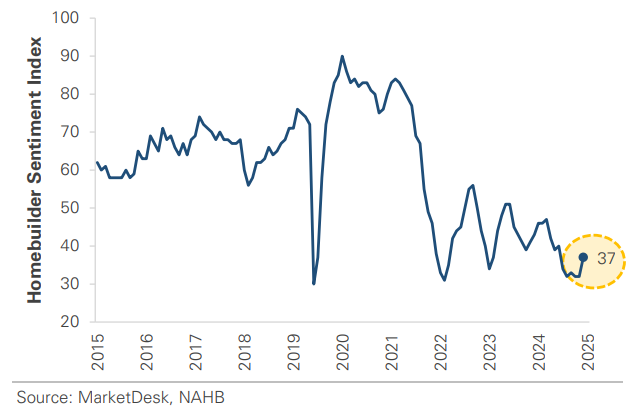
Homebuilder Sentiment Improves but Remains Weak
#4 - Government Shutdown and Delayed Economic Data.
One reason behind the uncertainty: the government shutdown and delayed economic data. The backlog began to clear this week with the release of the September jobs report, which showed payrolls grew by +119,000 (vs. the +50,000 estimate). However, the beat was partially offset by a rising unemployment rate (from 4.3% to 4.4%) and negative revisions to prior months' job growth. The data paints a mixed picture of a still-growing labor market with gradual cooling. Looking ahead, the Labor Department has canceled the October report and delayed the November report to 12/16, after the Fed's 12/9-12/10 meeting.
Implication: While job growth was better than expected, the data is outdated. The delay for the next report means the Fed will not have the most up-to-date information at its next meeting.
Job Growth Rebounded in September

US Unemployment Rises to a 4-Year High

#5 - Market Stages Brief Rebound
The market staged a brief rebound late in the week after Nvidia posted quarterly earnings that exceeded expectations. Q3 revenue grew +63% year-over-year, driven by the AI buildout and sales of computer chips to data centers. Guidance for the next quarter also surpassed forecasts, with CEO Jensen Huang describing demand as “off the charts.”
Implication: Nvidia’s blowout earnings validated AI demand and eased valuation concerns. While the results reset sentiment following the recent AI-driven selloff, optimism was short-lived, with the market giving back its post-Nvidia gains.
Important Disclosures
This material is provided for general and educational purposes only and is not investment advice. Your investments should correspond to your financial needs, goals, and risk tolerance. Please consult an investment professional before making any investment or financial decisions or purchasing any financial, securities, or investment-related service or product, including any investment product or service described in these materials.
Our Insights


